 Built In Oasis
AI Material Price Shock Monitor
Functional DemoMaterial price-shock monitoring that ties supplier price movement to margin exposure and pricing recommendations.
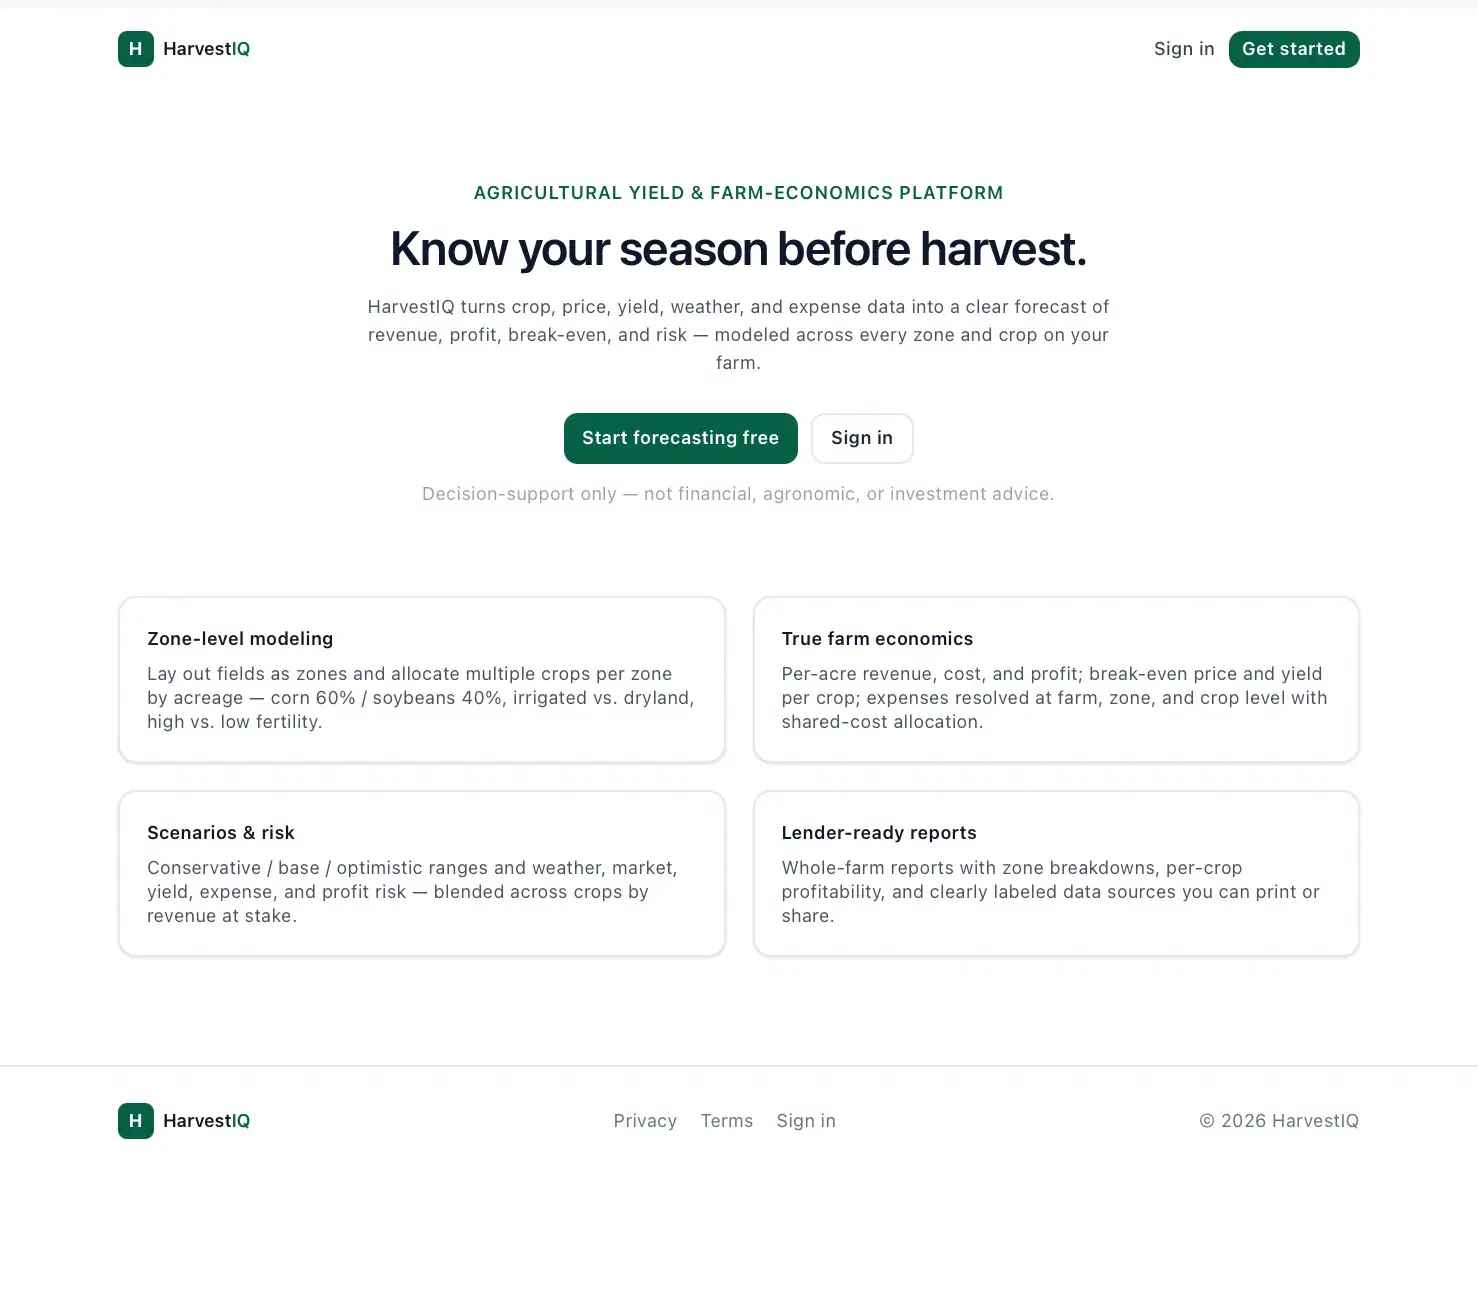
A crop revenue and profit forecasting engine that models yield, price, expenses, risk, and break-even before harvest.
Farm income depends on acres, yield, weather, input costs, commodity prices, basis, contracts, and insurance — factors that live in scattered spreadsheets, broker calls, weather tools, and USDA data and are rarely connected. Farmers still have to manually answer what they are likely to make, what happens if price or yield drops, and where their break-even sits, so they are often surprised by margin compression.
Built for Large farm owners and farm managers/operators; secondarily farm CFOs/controllers, agricultural consultants, and agricultural lenders.
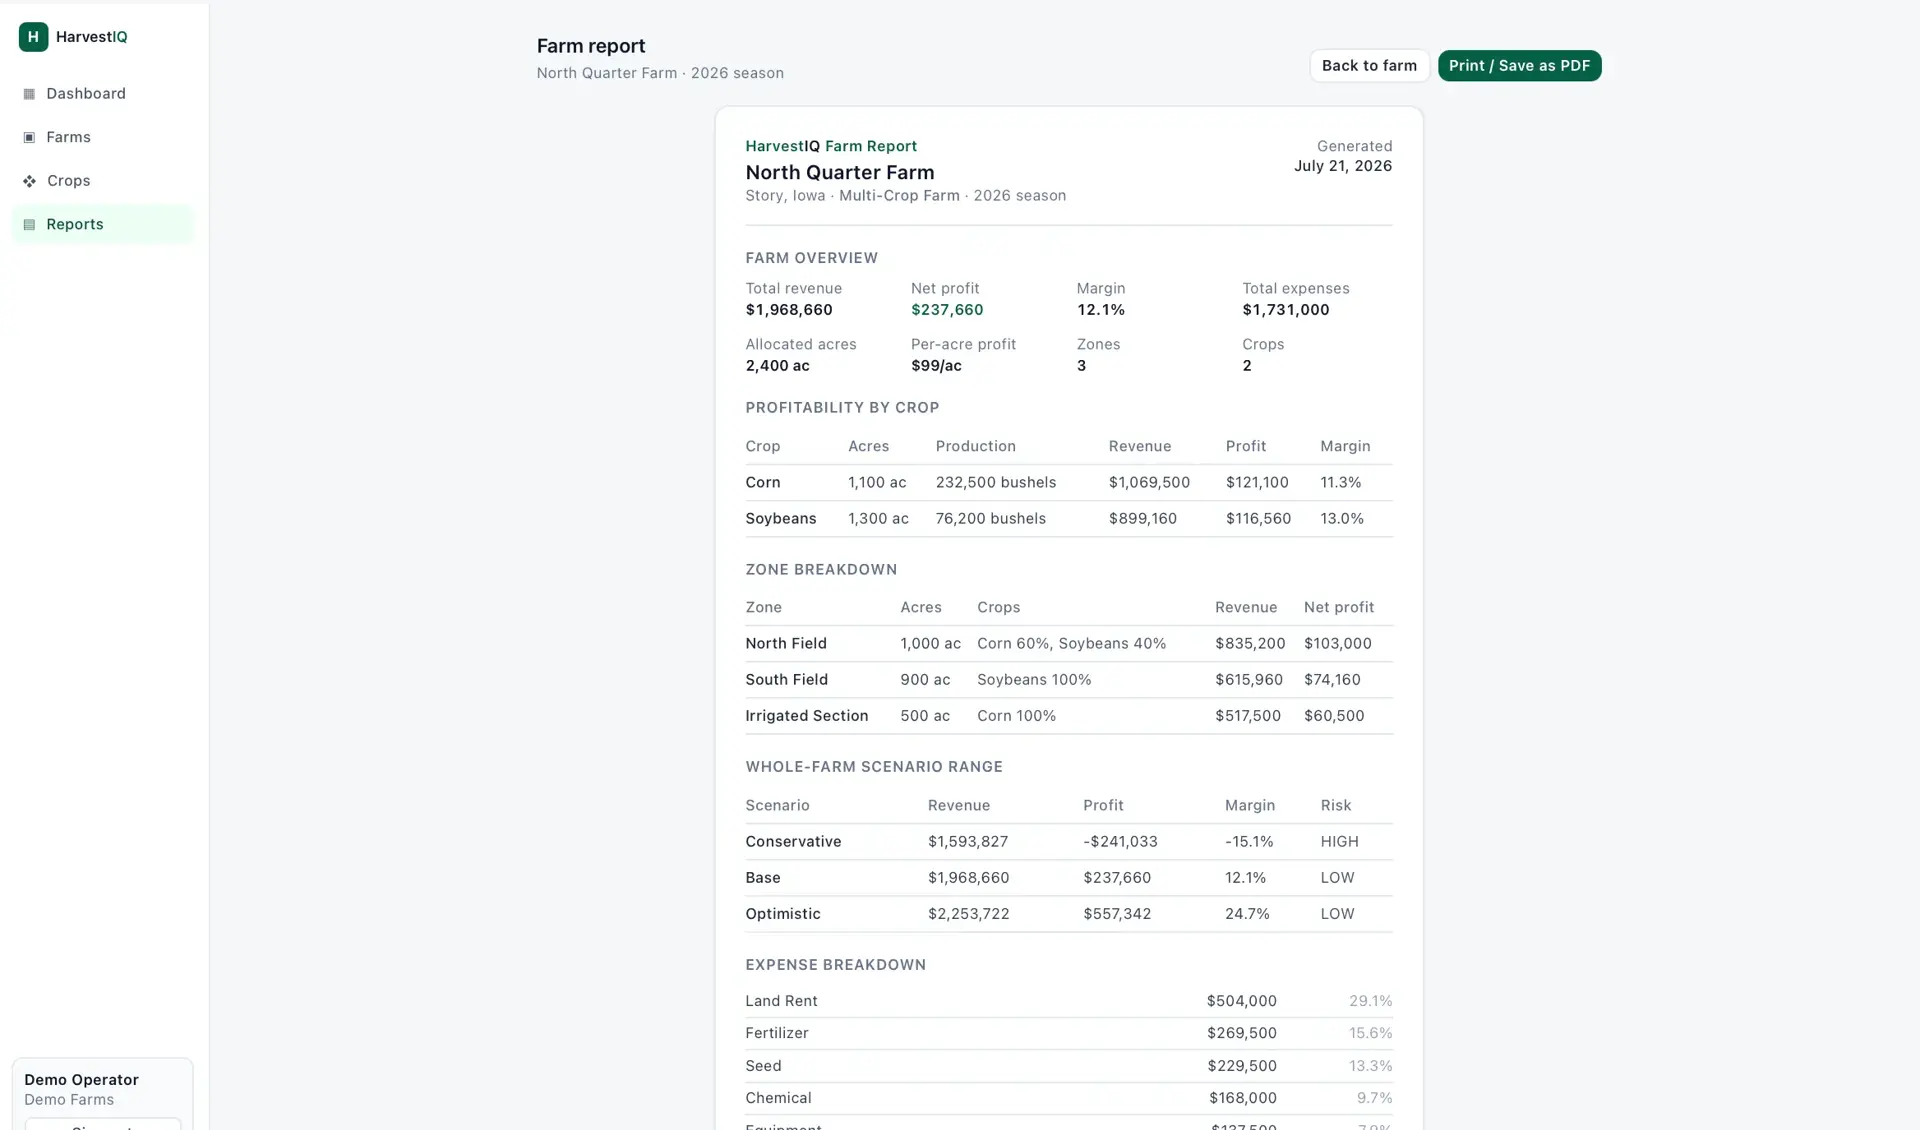
HarvestIQ turns crop, acreage, yield, price, and expense inputs into a clear seasonal profit forecast months before harvest. It computes gross revenue, net profit, margin, break-even price, and break-even yield, and generates conservative, base, and optimistic scenarios alongside weather, market, yield, expense, and overall risk scores. A confidence model tells users how much to trust each forecast, every assumption is labeled by source, and reports are lender-ready. External market and weather data flow through provider adapters with clearly labeled sample-versus-live data.
The engineering focus is a clean separation of forecast, scenario, risk, and confidence logic into tested service modules kept out of the UI, plus a provider-adapter architecture (market, weather, yield, expense) that labels every value's source, confidence, and mock/live status and supports manual overrides. Financial formulas handle edge cases (zero production, zero price/acres) safely, and calculations are unit-tested.
HarvestIQ helps farms forecast crop revenue, profit, and risk months before harvest — combining scattered price, weather, yield, and expense data into one clear seasonal forecast.
Revenue Calculation Engine
Computes gross revenue, production, and per-acre revenue from harvested acres, yield, and price.
Expense Calculation Engine
Normalizes per-acre and total expenses across 18 categories into true net profit.
Scenario ModelingConservative / Base / Optimistic
Generates conservative, base, and optimistic cases with adjusted yield, price, and expenses.
Risk Scoring
Scores weather, market, yield, expense, profit, and overall risk with plain-English drivers.
Confidence Model
Rates forecast trust as high, medium, or low based on data completeness and season timing.
Break-Even Analysis
Calculates break-even price and break-even yield with safe handling of zero values.
Market Data Layer
Blends contracted, cash, futures-plus-basis, and benchmark prices through a defined price hierarchy.
Weather Risk Layer
Abstracts drought, heat, rainfall, soil-moisture, and irrigation risk into a weather outlook.
Crop Library
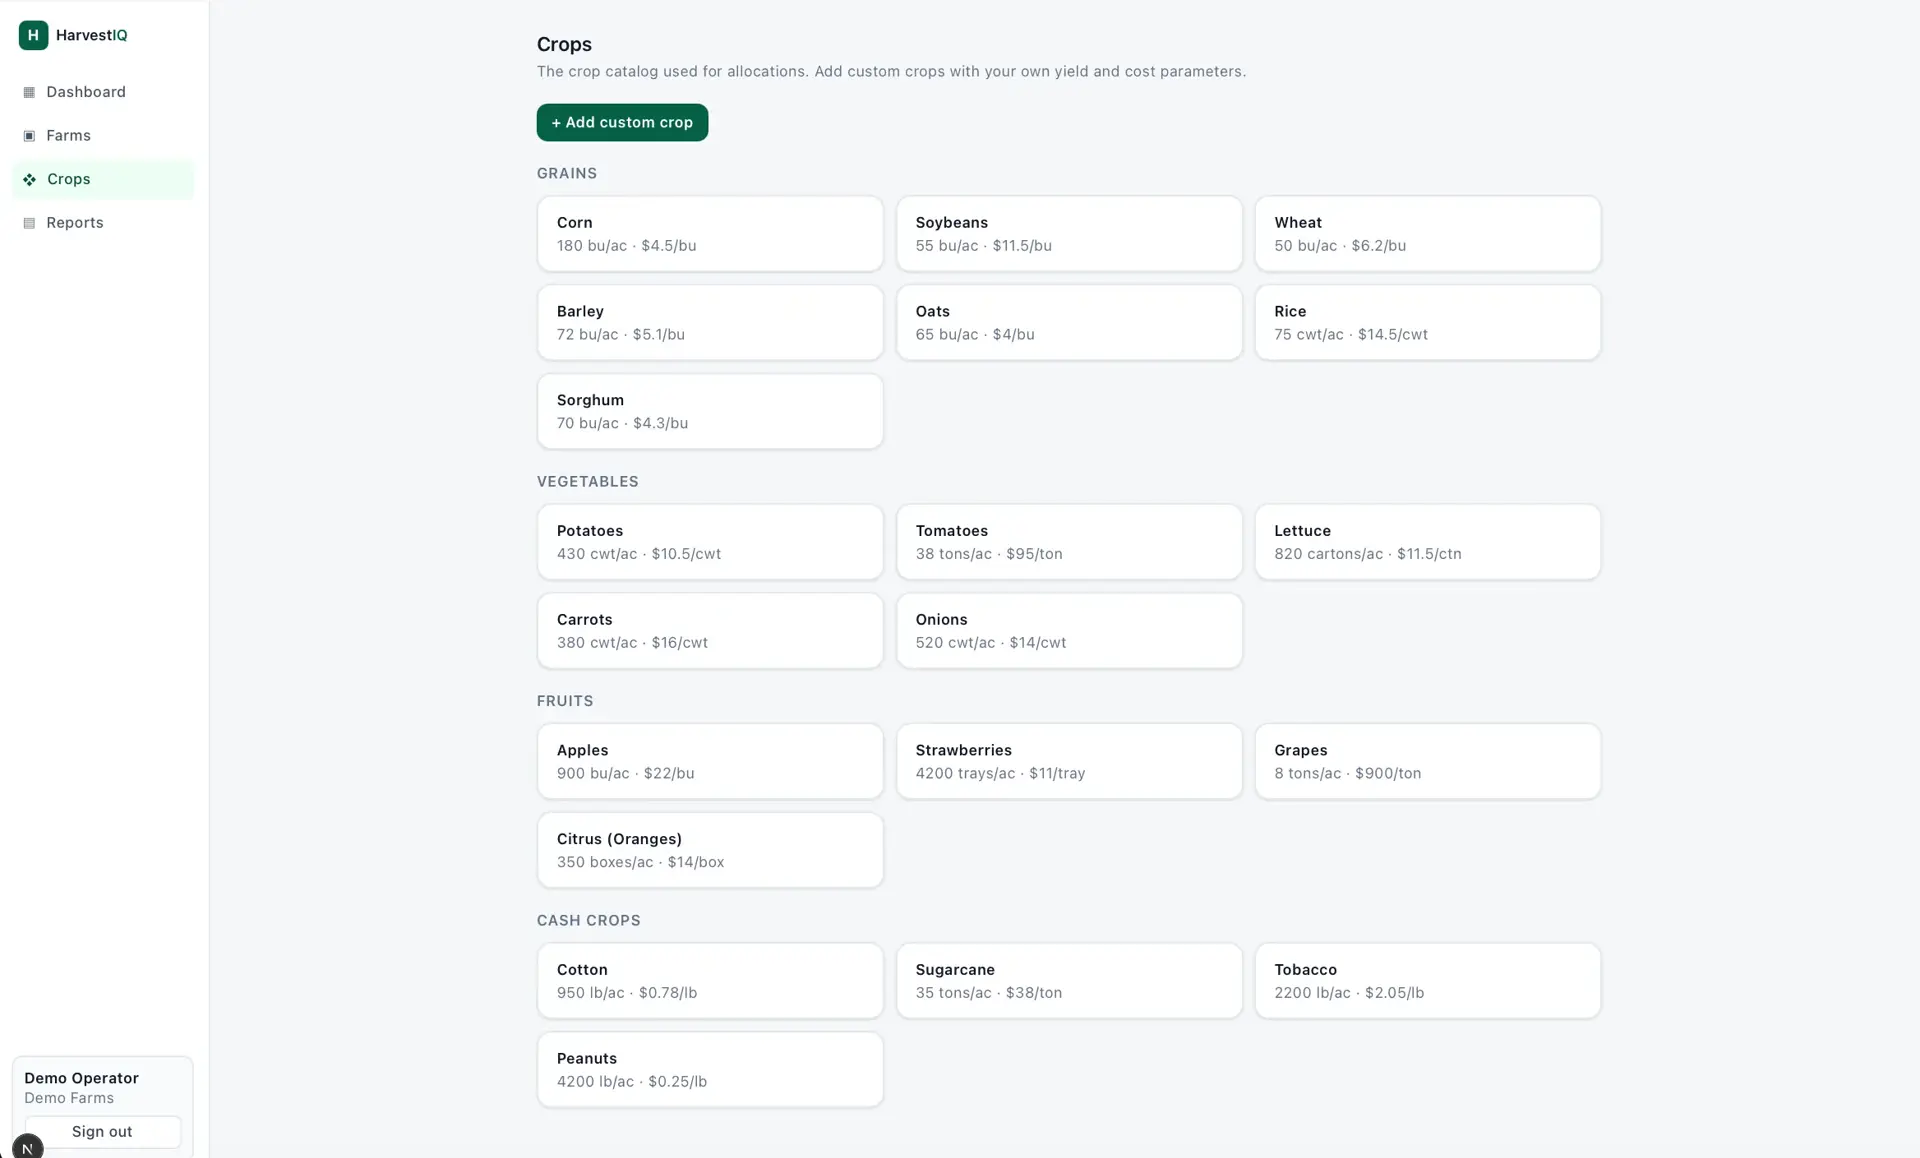
Defines nine U.S. crops with units, defaults, expense templates, and sensitivity settings.
Manual Override Layer
Lets users override yield, price, expenses, basis, acres, and contract terms, with tracking.
Provider Data Architecture
Routes market, weather, yield, and benchmark data through labeled providers, never faking live data.
Report Generator
Produces lender-ready reports with forecast, scenarios, expenses, risk, and assumptions.
Overall Risk
Drought, heat, precipitation, soil-moisture, and irrigation exposure.
Price volatility, basis uncertainty, and share of crop contracted.
County and farm yield variance, crop stage, and weather stress.
Fertilizer, fuel, labor, interest, and land-rent exposure.
Distance between expected and break-even price and yield.
Combined seasonal risk level with the main driver.
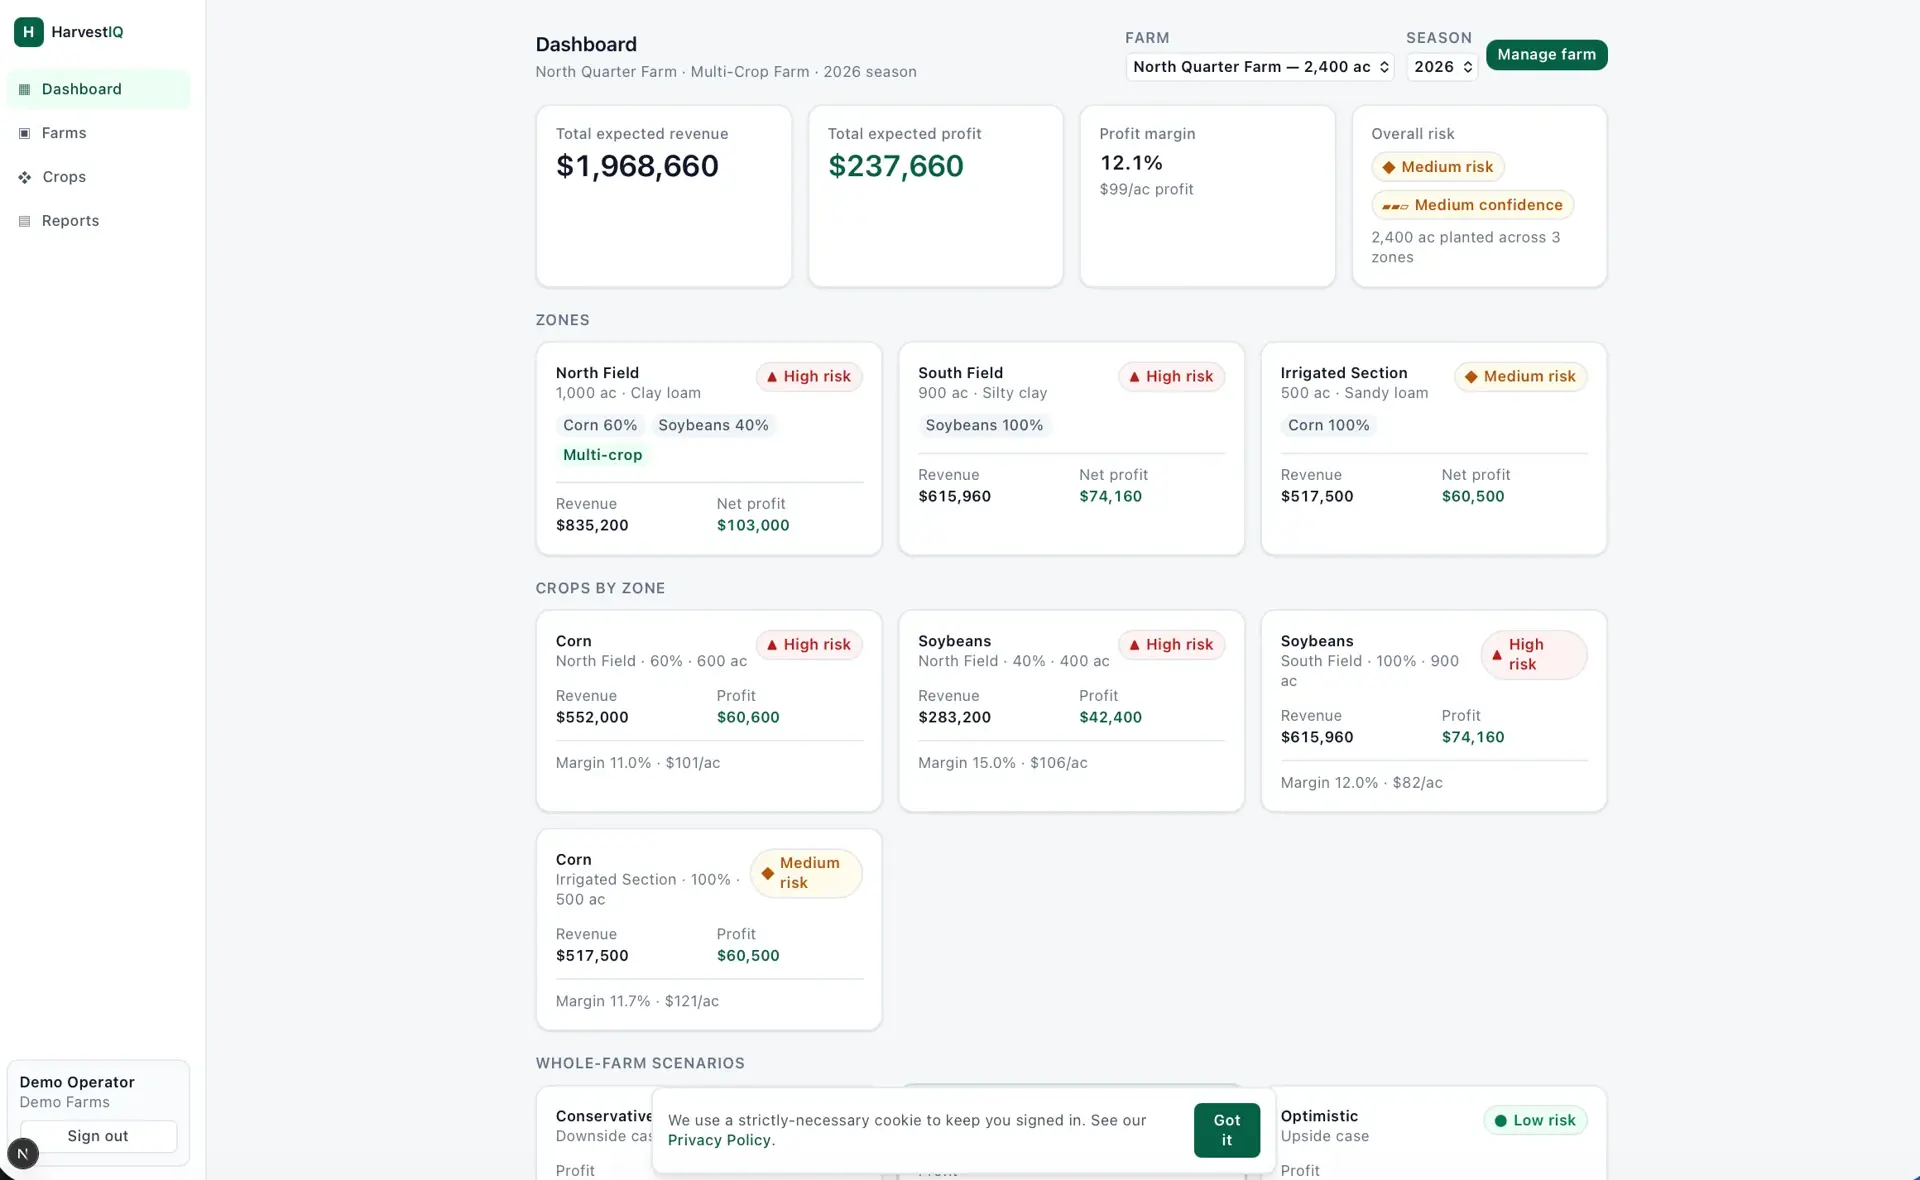
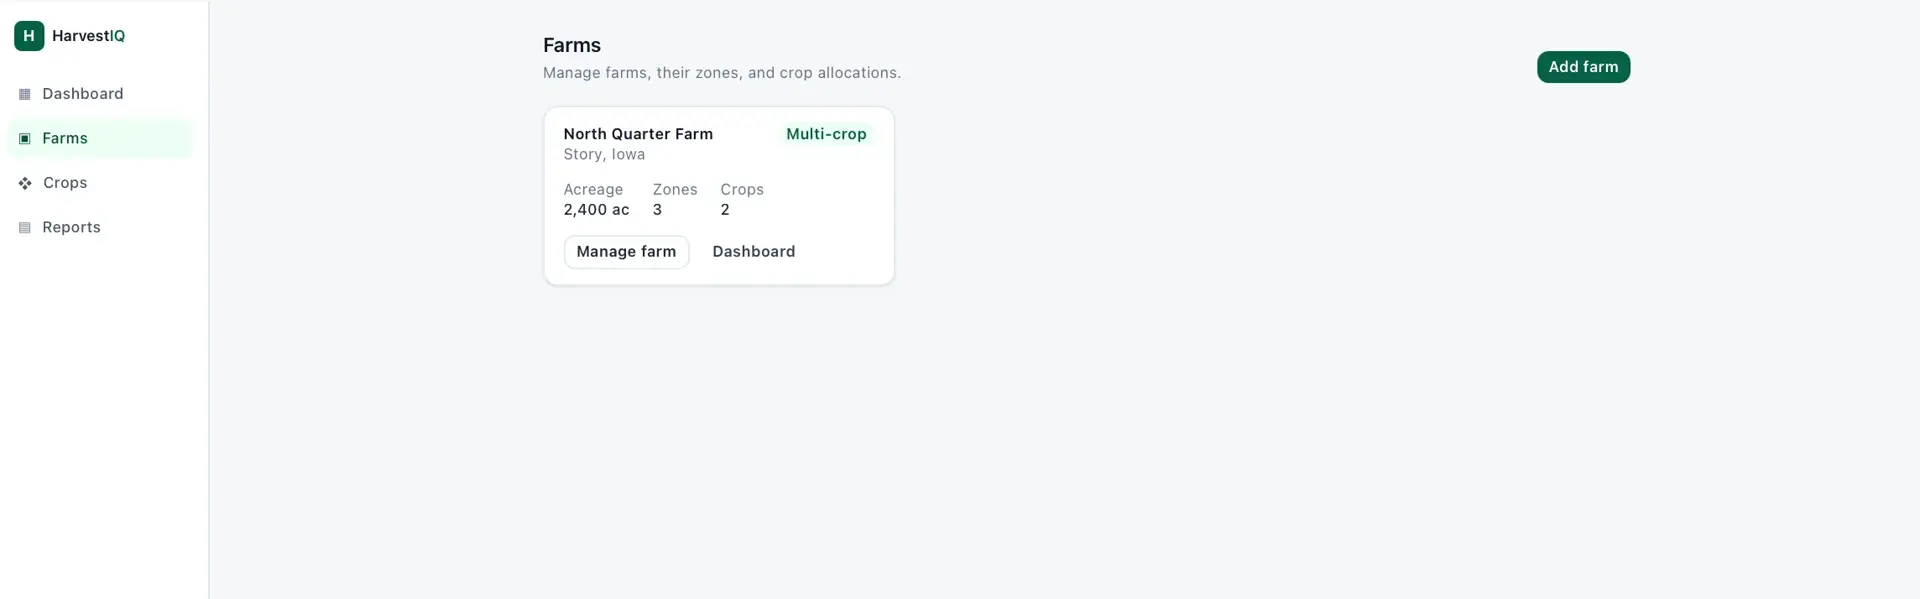
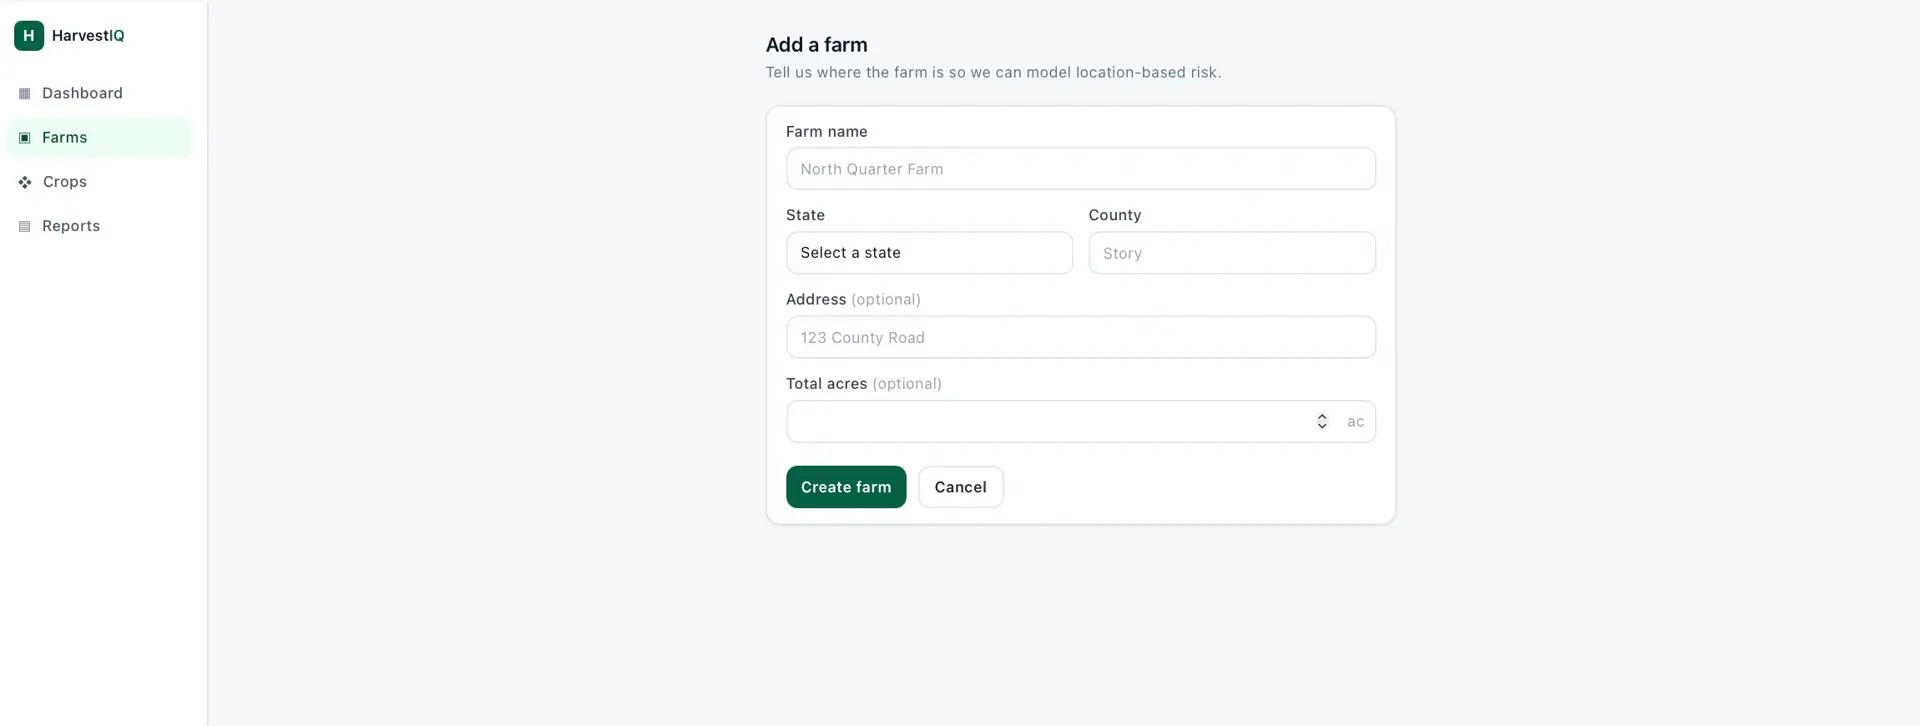
A Next.js app using Prisma over SQLite in development and PostgreSQL in production, with Auth.js for accounts and organizations. Forecast, scenario, risk, and confidence calculations live in dedicated service modules; external market and weather data are fetched through provider adapters (sample/mock by default, live weather via a keyless provider when configured), each result tagged with source and confidence.
Material price-shock monitoring that ties supplier price movement to margin exposure and pricing recommendations.
Location intelligence that scores ZIP codes by industry-specific expansion opportunity.
Real-time operational and financial intelligence for trucking and logistics companies.
Start a project and reference this one — the conversation begins with what you have already seen.
Start a project