 Built In Oasis
Load Profit Calculator
Functional DemoA profitability decision tool that tells truckers whether a load is worth taking before they accept it.
Real-time operational and financial intelligence for trucking and logistics companies.
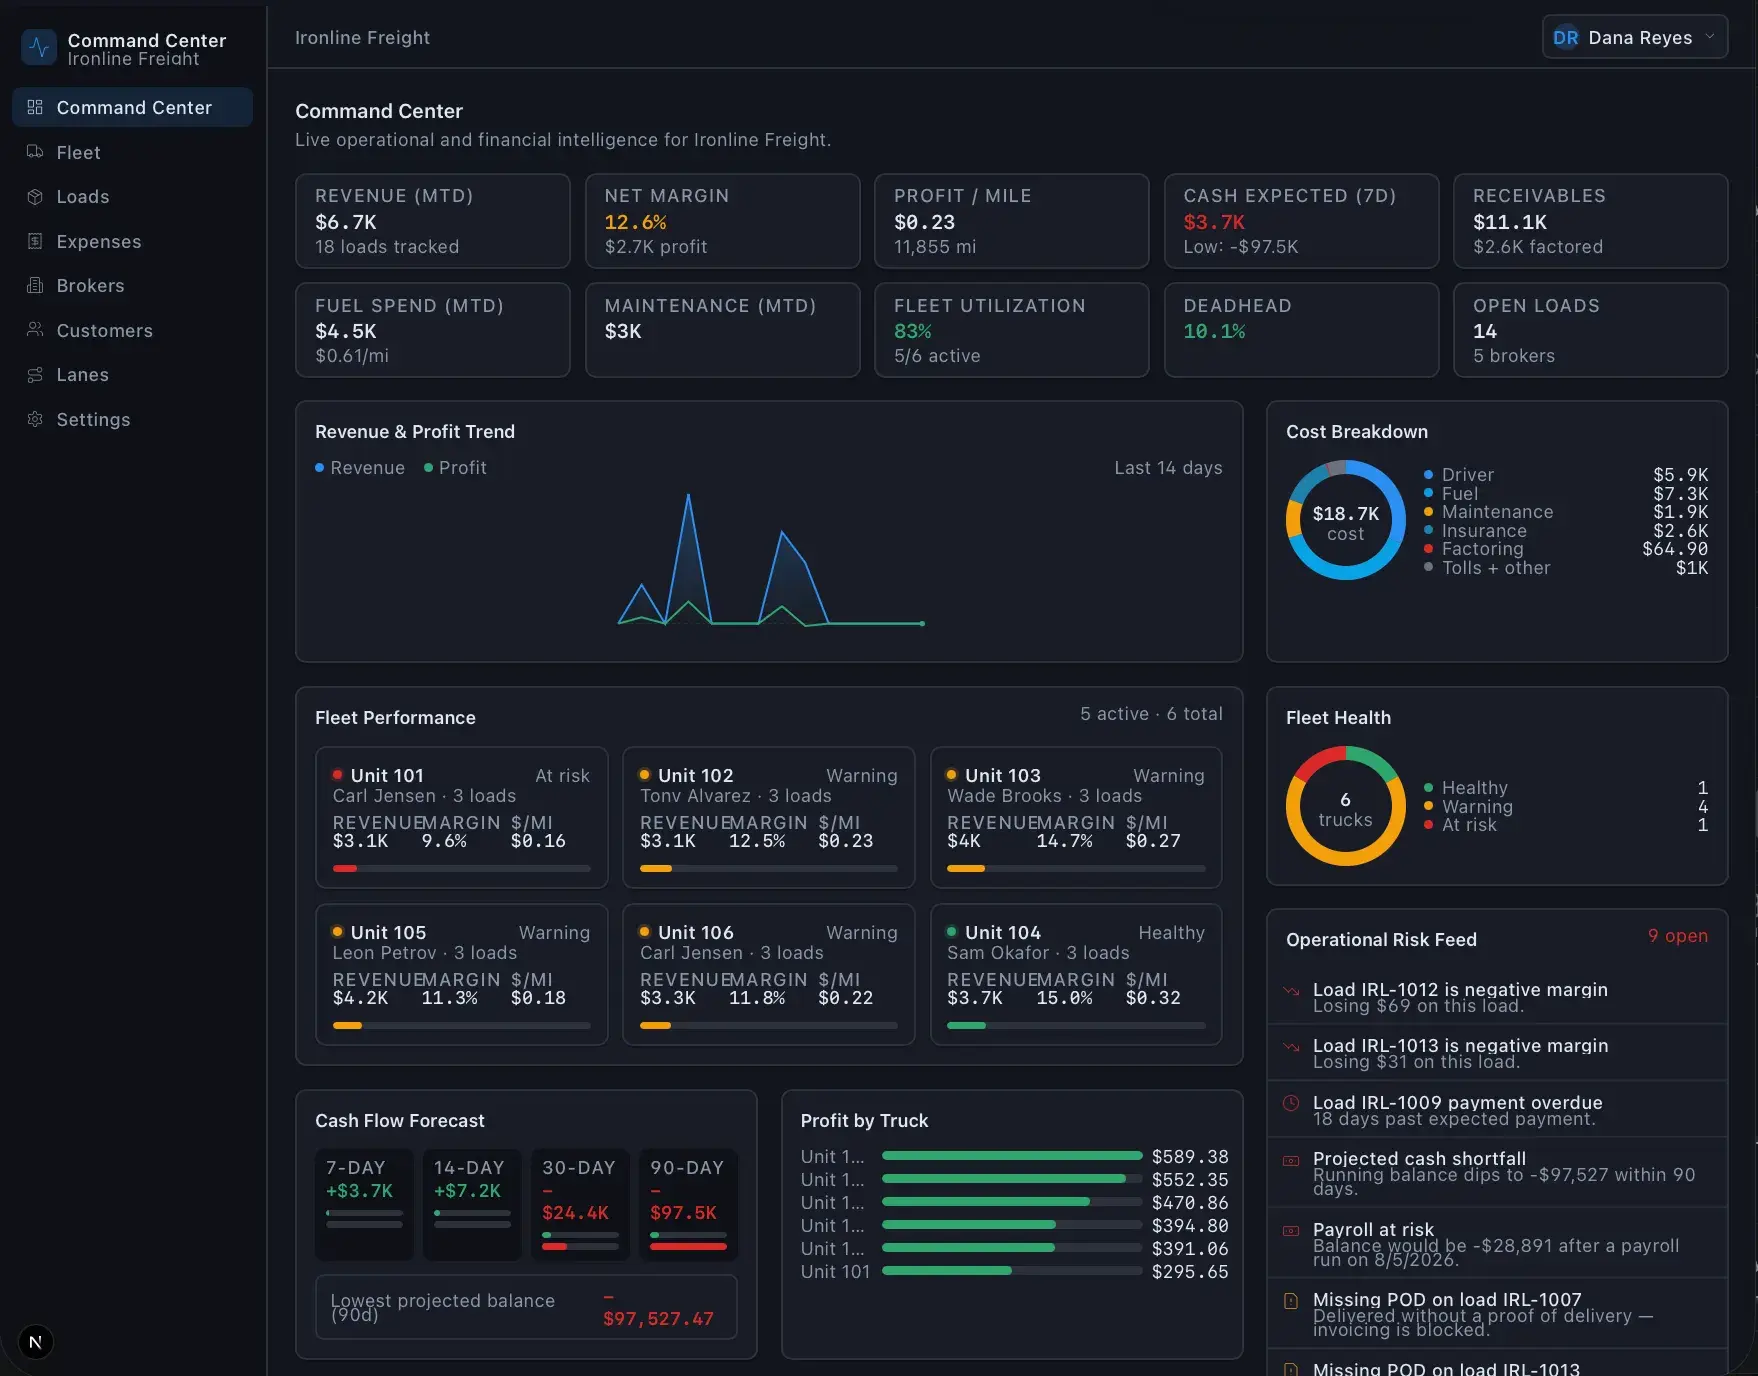
Trucking companies optimize revenue instead of profitability, and a truck can post large gross revenue while losing money to fuel inefficiency, deadhead, poor lane selection, slow broker payments, and maintenance surprises. The industry runs on fragmented software: spreadsheets, dispatch tools, fuel portals, accounting apps, and broker email chains. No system unifies operational profitability intelligence.
Built for Owner-operators, small and mid-size fleets, and enterprise carriers managing truck, lane, and broker profitability.
Fleet Cash Flow Command Center answers one question within seconds of login: where money is being made, where it is being lost, and what action to take next. It tracks profitability by truck, driver, lane, broker, and customer, forecasts cash flow across 7- to 90-day windows, and follows every load through a booked-to-paid lifecycle. A breakeven engine warns whether a load is above, near, or below breakeven at dispatch, and broker and lane intelligence engines score payment reliability and lane margin. An operational risk feed surfaces late payments, missing PODs, negative-margin loads, and cash shortages, and reports export to CSV and PDF.
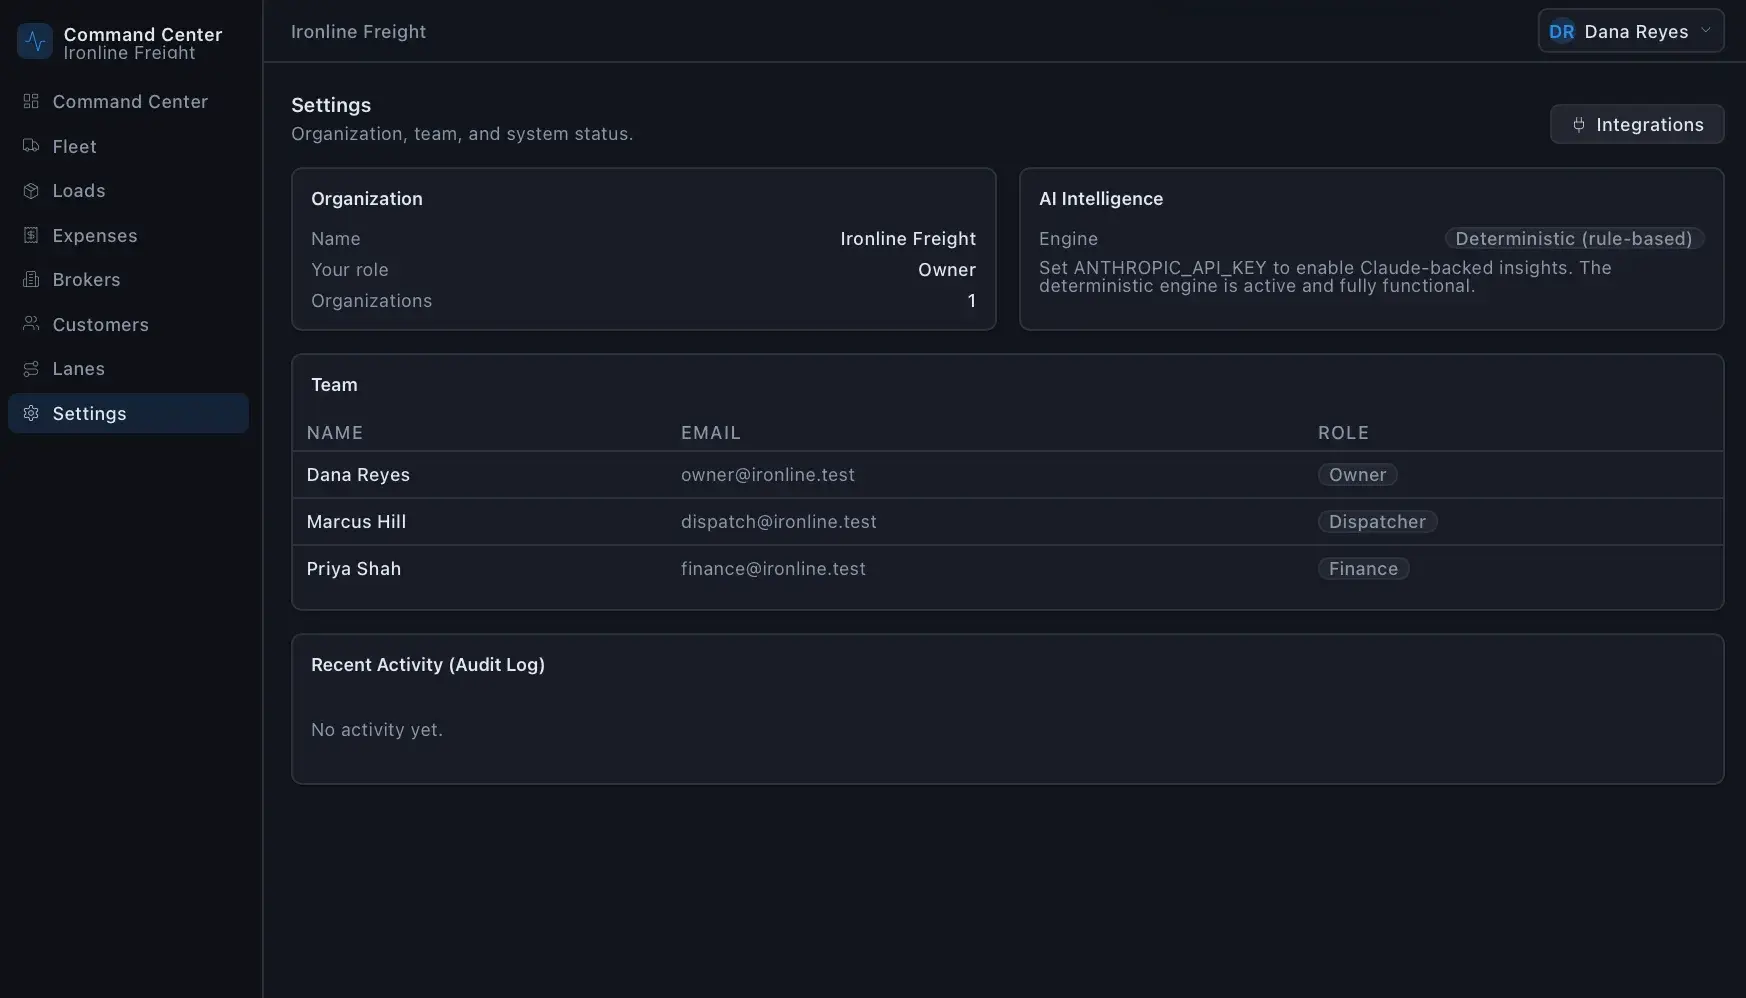
Centralizes all profitability math in one engine with no duplicated business logic, computing per-truck, per-lane, and per-broker margins, cost-per-mile, and deadhead. Adds a breakeven calculator that produces recommended and danger-threshold rates, a multi-period cash flow forecaster with risk alerts, and a broker scoring model. Built as a multi-tenant system with granular role-based permissions.
Most trucking tools track dispatch, GPS, and compliance. This one is a Bloomberg Terminal for trucking operations, built around margin, cash flow, and operational profitability.
Fleet profitability intelligence
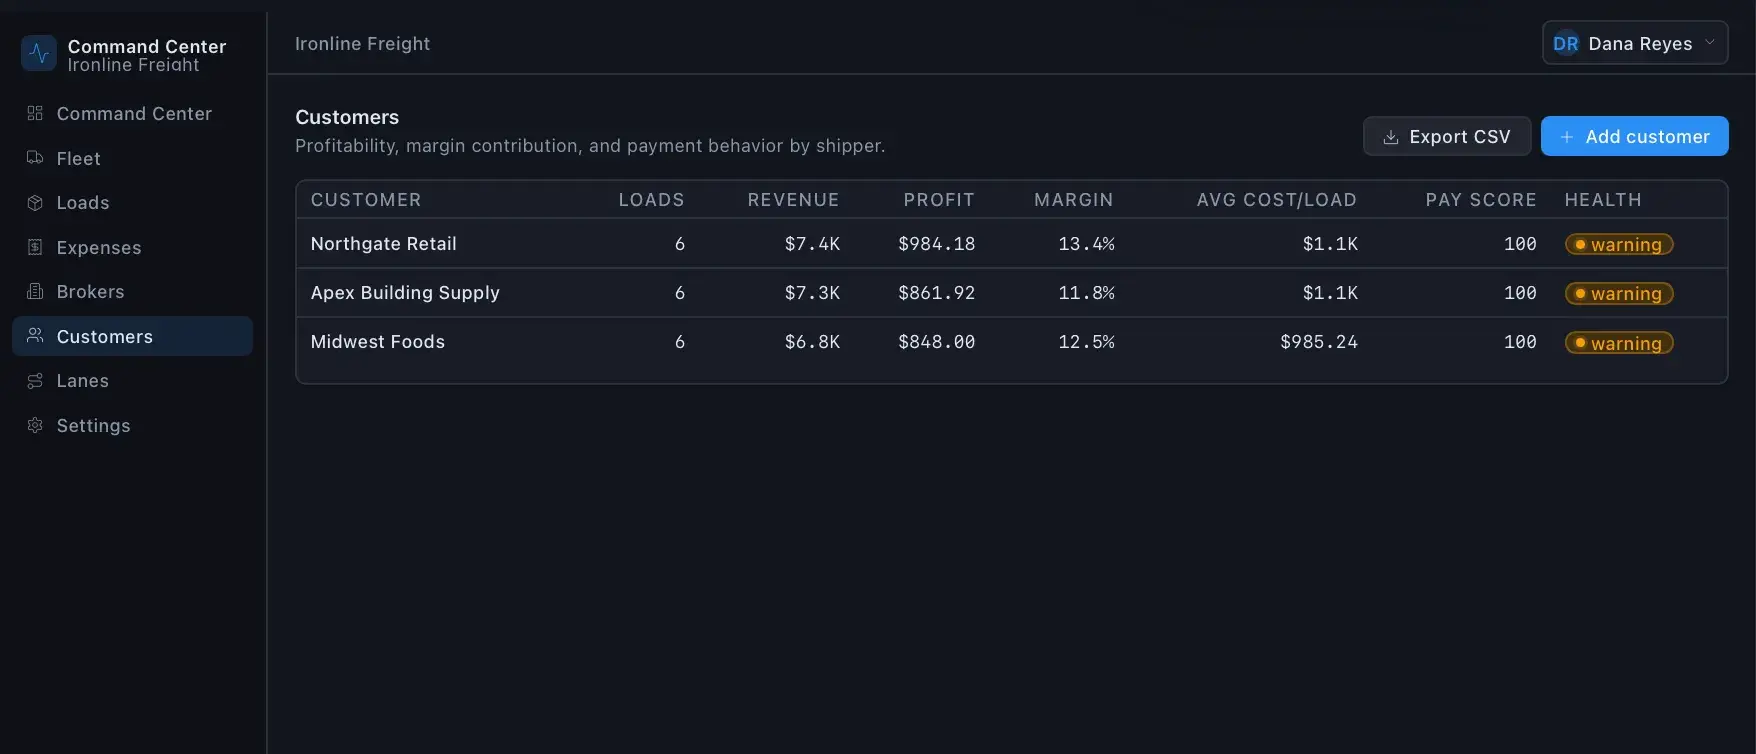
Profit by truck, driver, lane, broker, and customer.
Cash flow command center
Forecasts receivables, obligations, and negative cash events.
Load-to-cash visibility
Every load tracked from booked to reconciled.
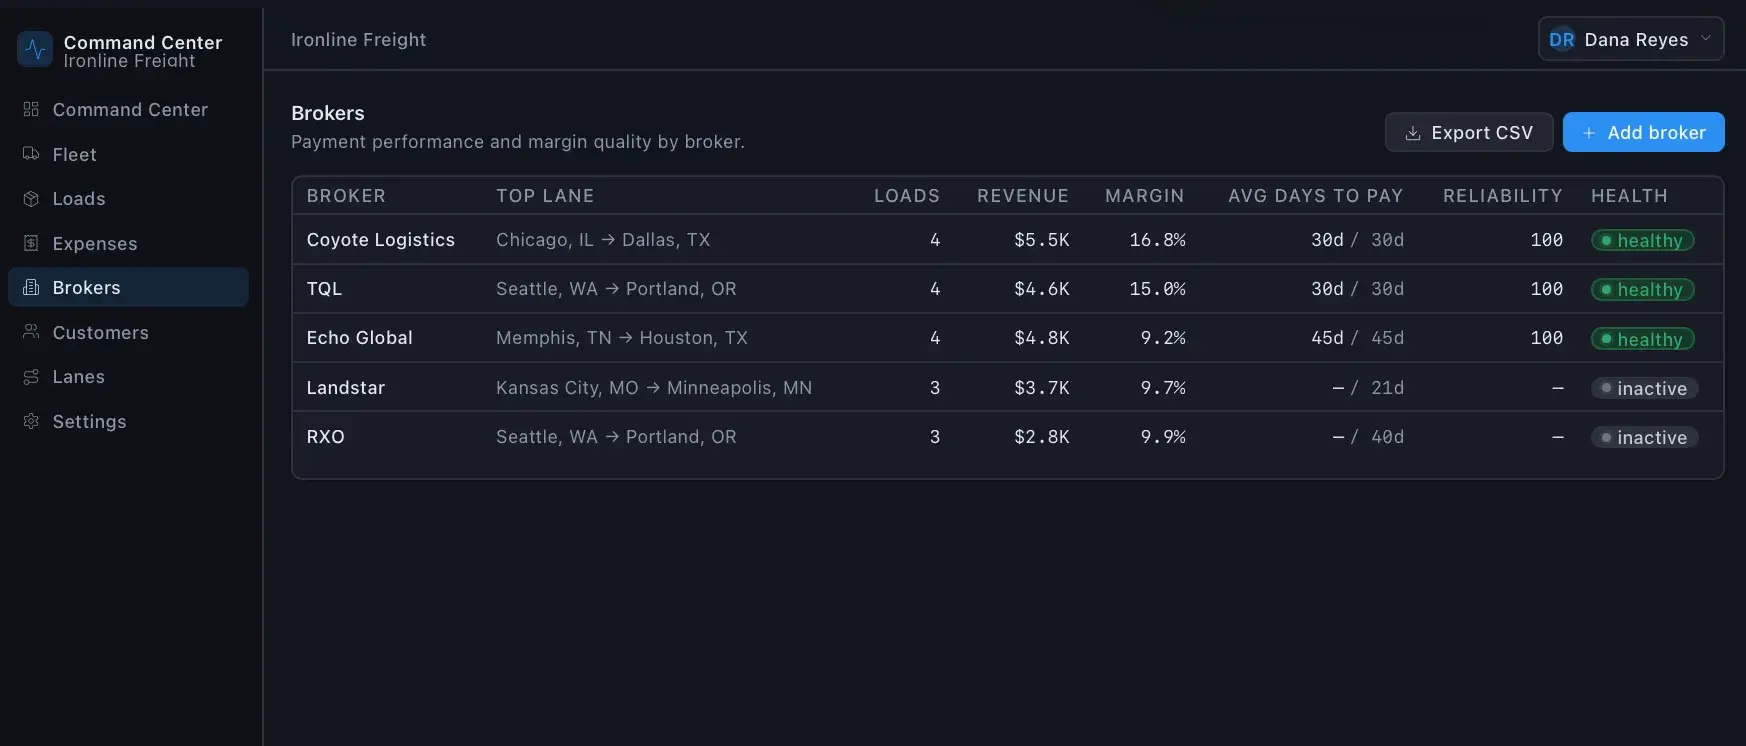
Broker intelligence
Scores brokers on payment speed, reliability, and margin quality.
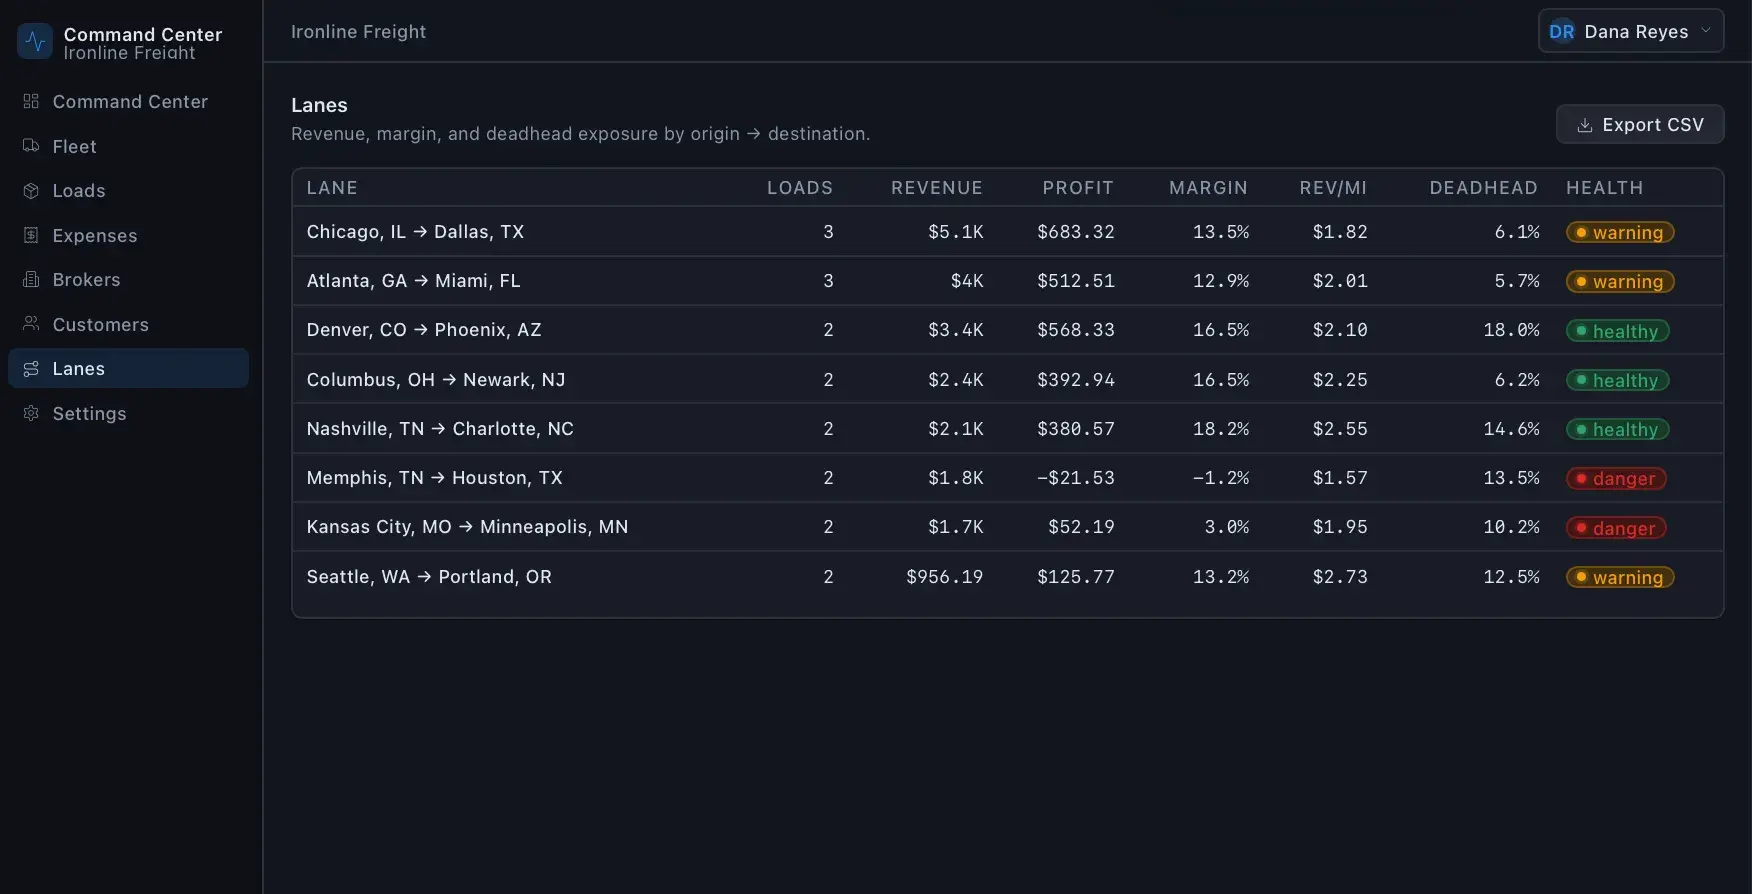
Lane intelligence
Analyzes lane margin, fuel, deadhead, and cash velocity.
Asset intelligence
Tracks maintenance burden, downtime cost, and replacement thresholds.
Breakeven engine
Warns above, near, or below breakeven at dispatch.
Cash flow forecasting engine
7-, 14-, 30-, and 90-day forecasts with risk alerts.
Profitability engine
Centralized margin and cost-per-mile calculations.
Driver performance system
Fuel efficiency, idle, and load profitability by driver.
Maintenance intelligence
Cost-trend, downtime, and preventive-maintenance signals.
Factoring intelligence
Tracks factoring fees, reserve releases, and dependency.
Document management
PODs, rate confirmations, and invoices with tagging.
Operational risk feed
Late payments, missing PODs, and negative-margin loads.
Reporting engine
Fleet, truck, lane, and broker reports exported to CSV and PDF.
Load-to-cash lifecycle
Broker Score
Consistency of paying in full.
Average days to pay.
Profitability of the broker's loads.
Dependability across lanes and loads.
Rate of claims raised.
Completeness of rate confirmations and paperwork.
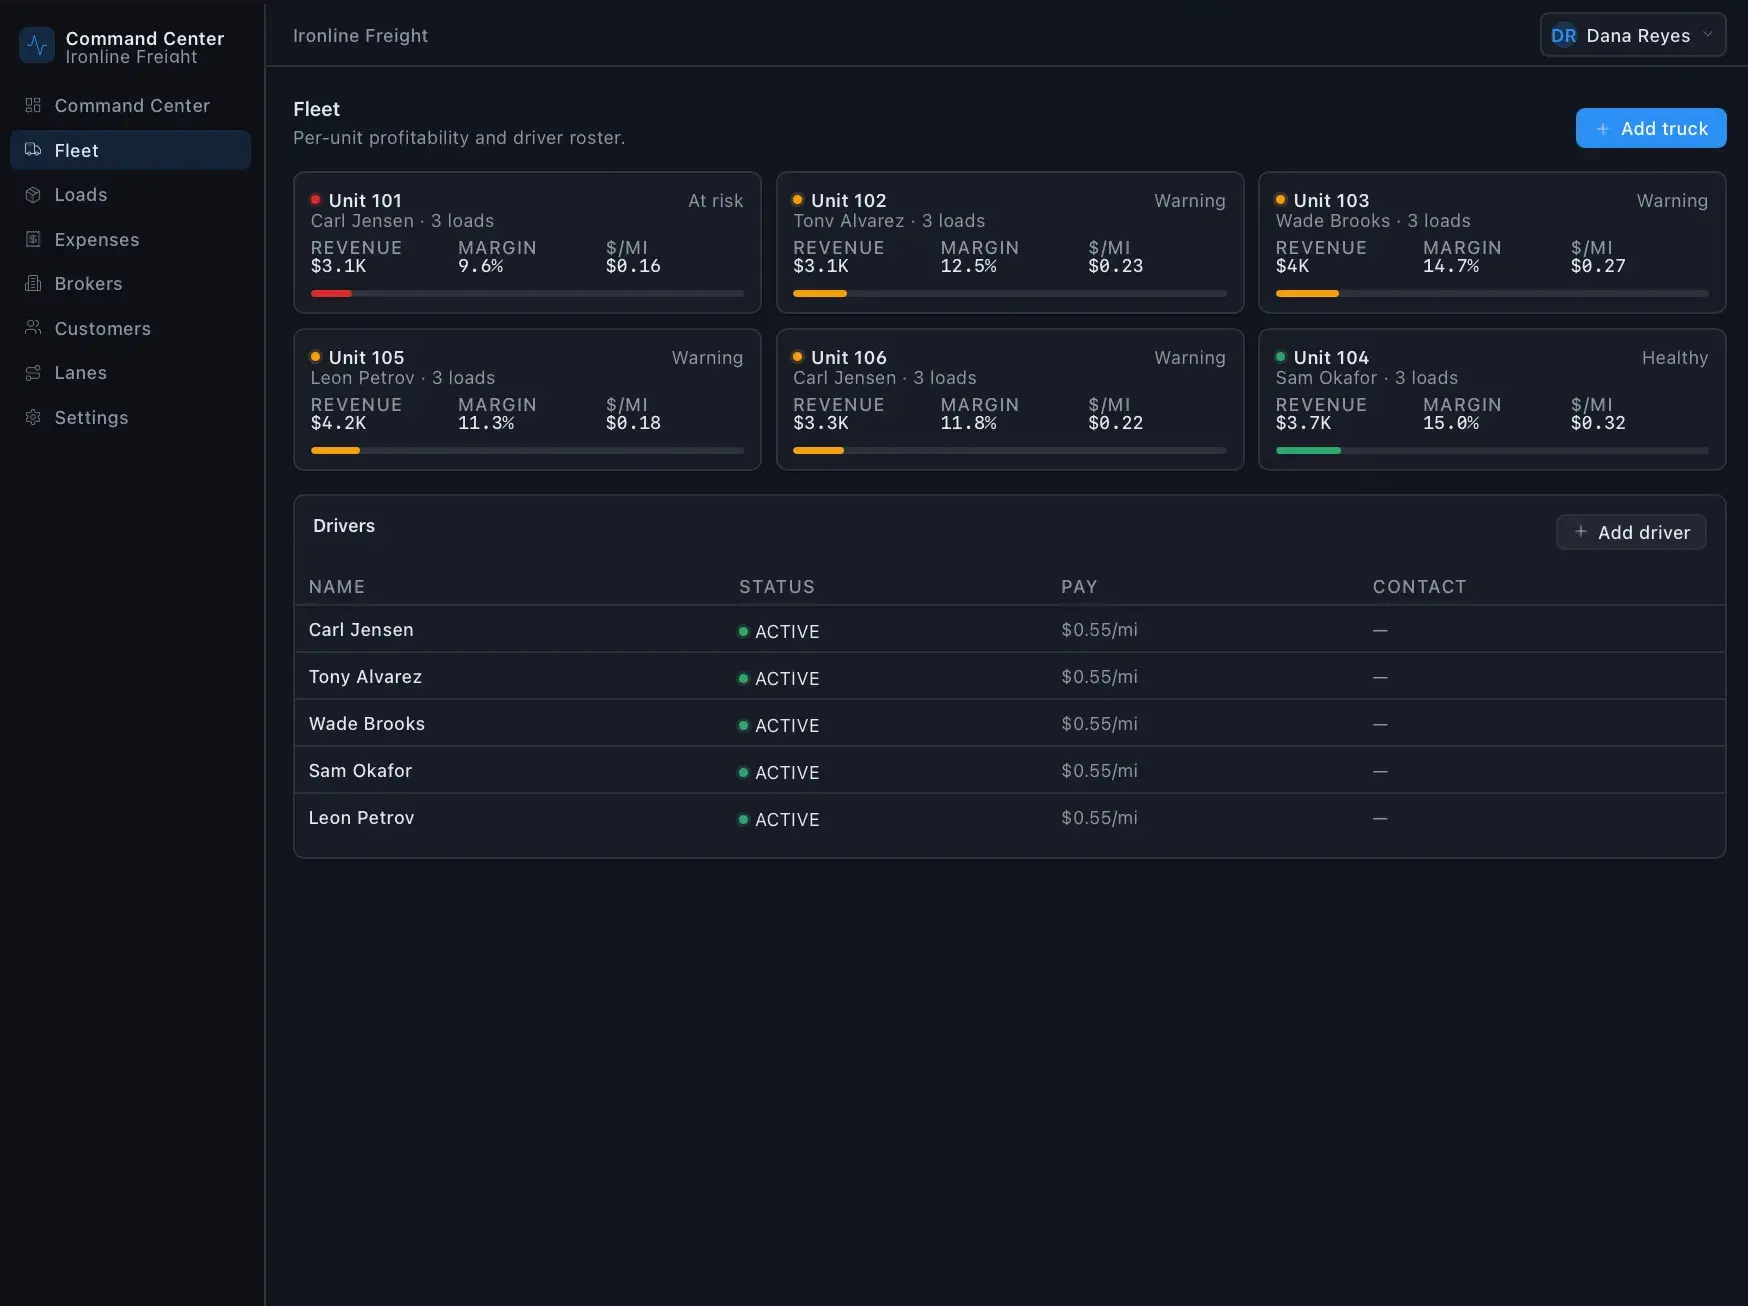
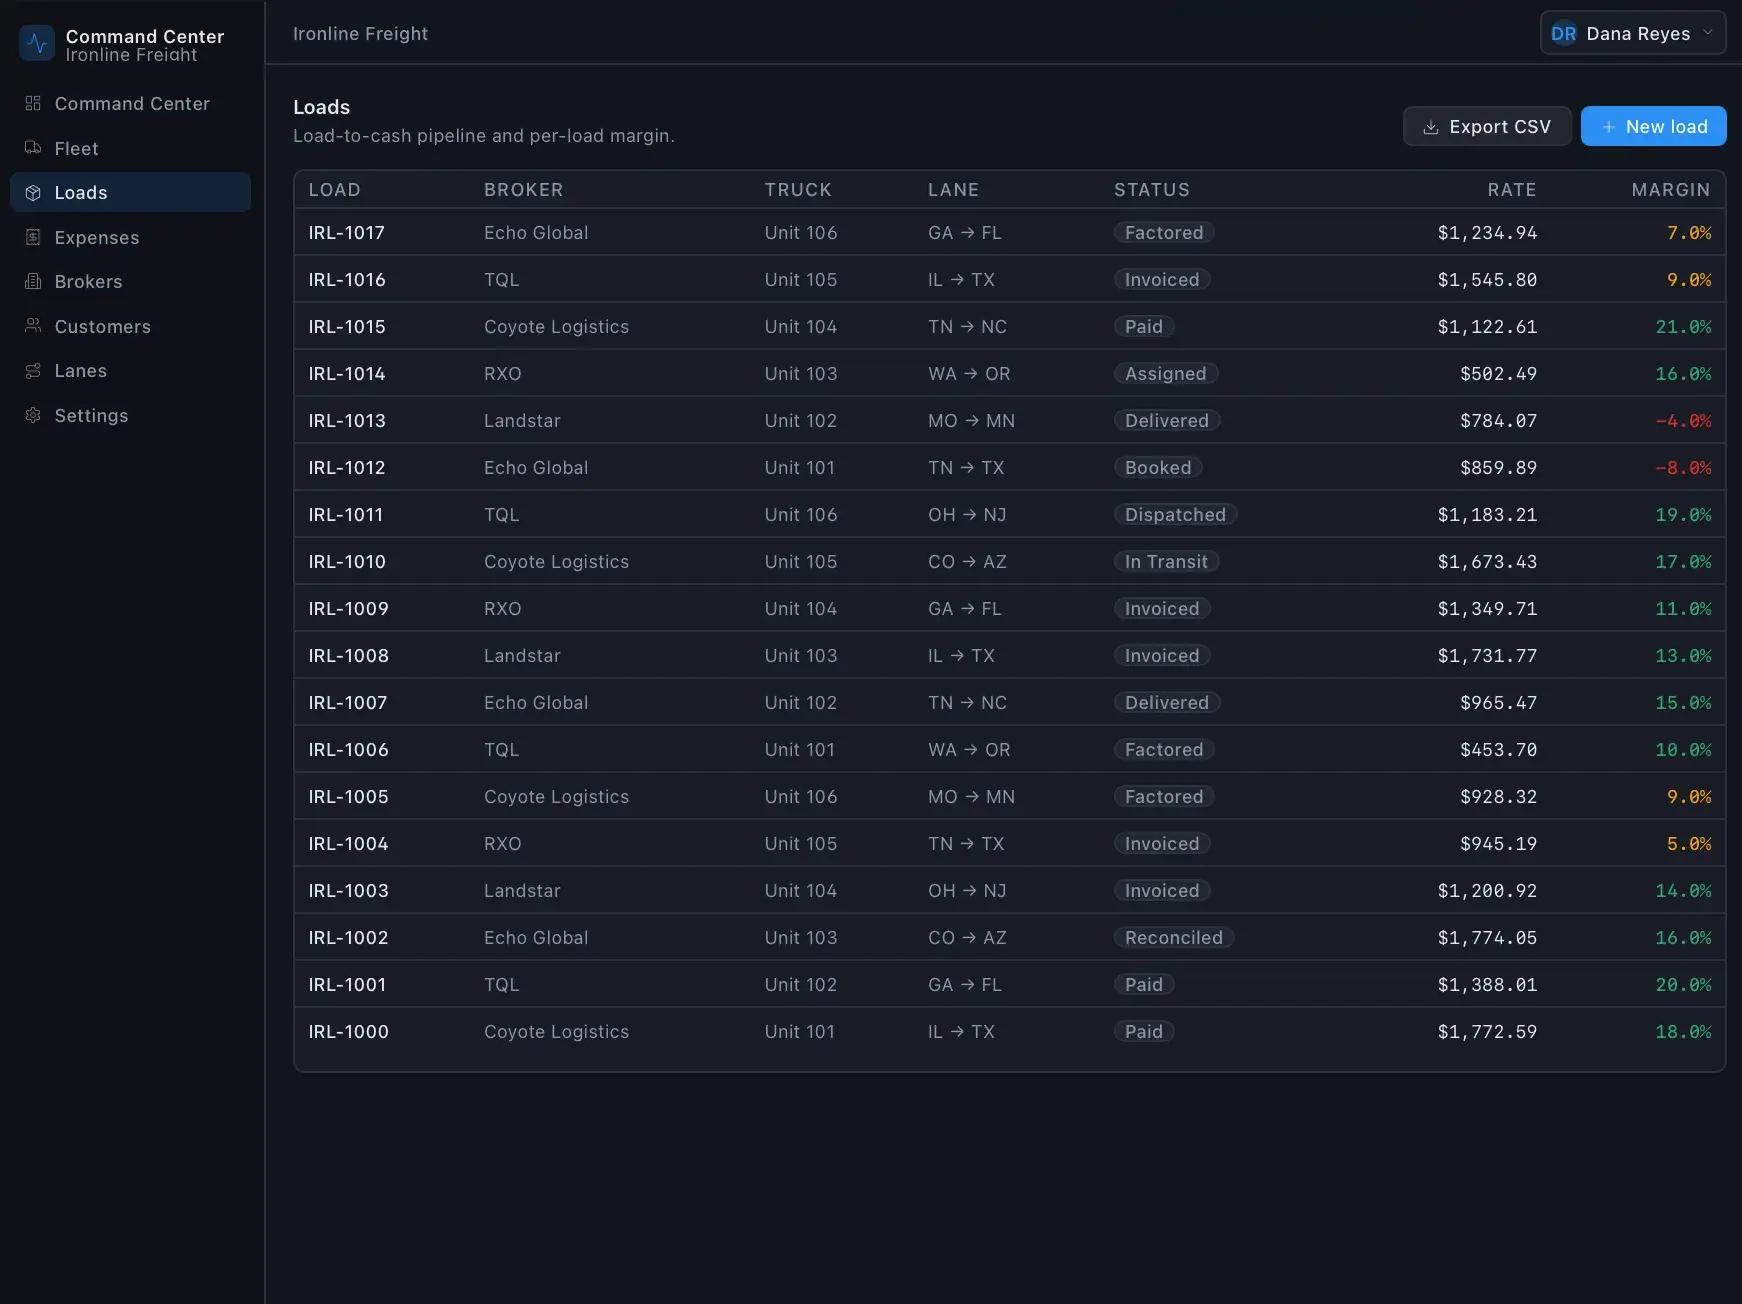
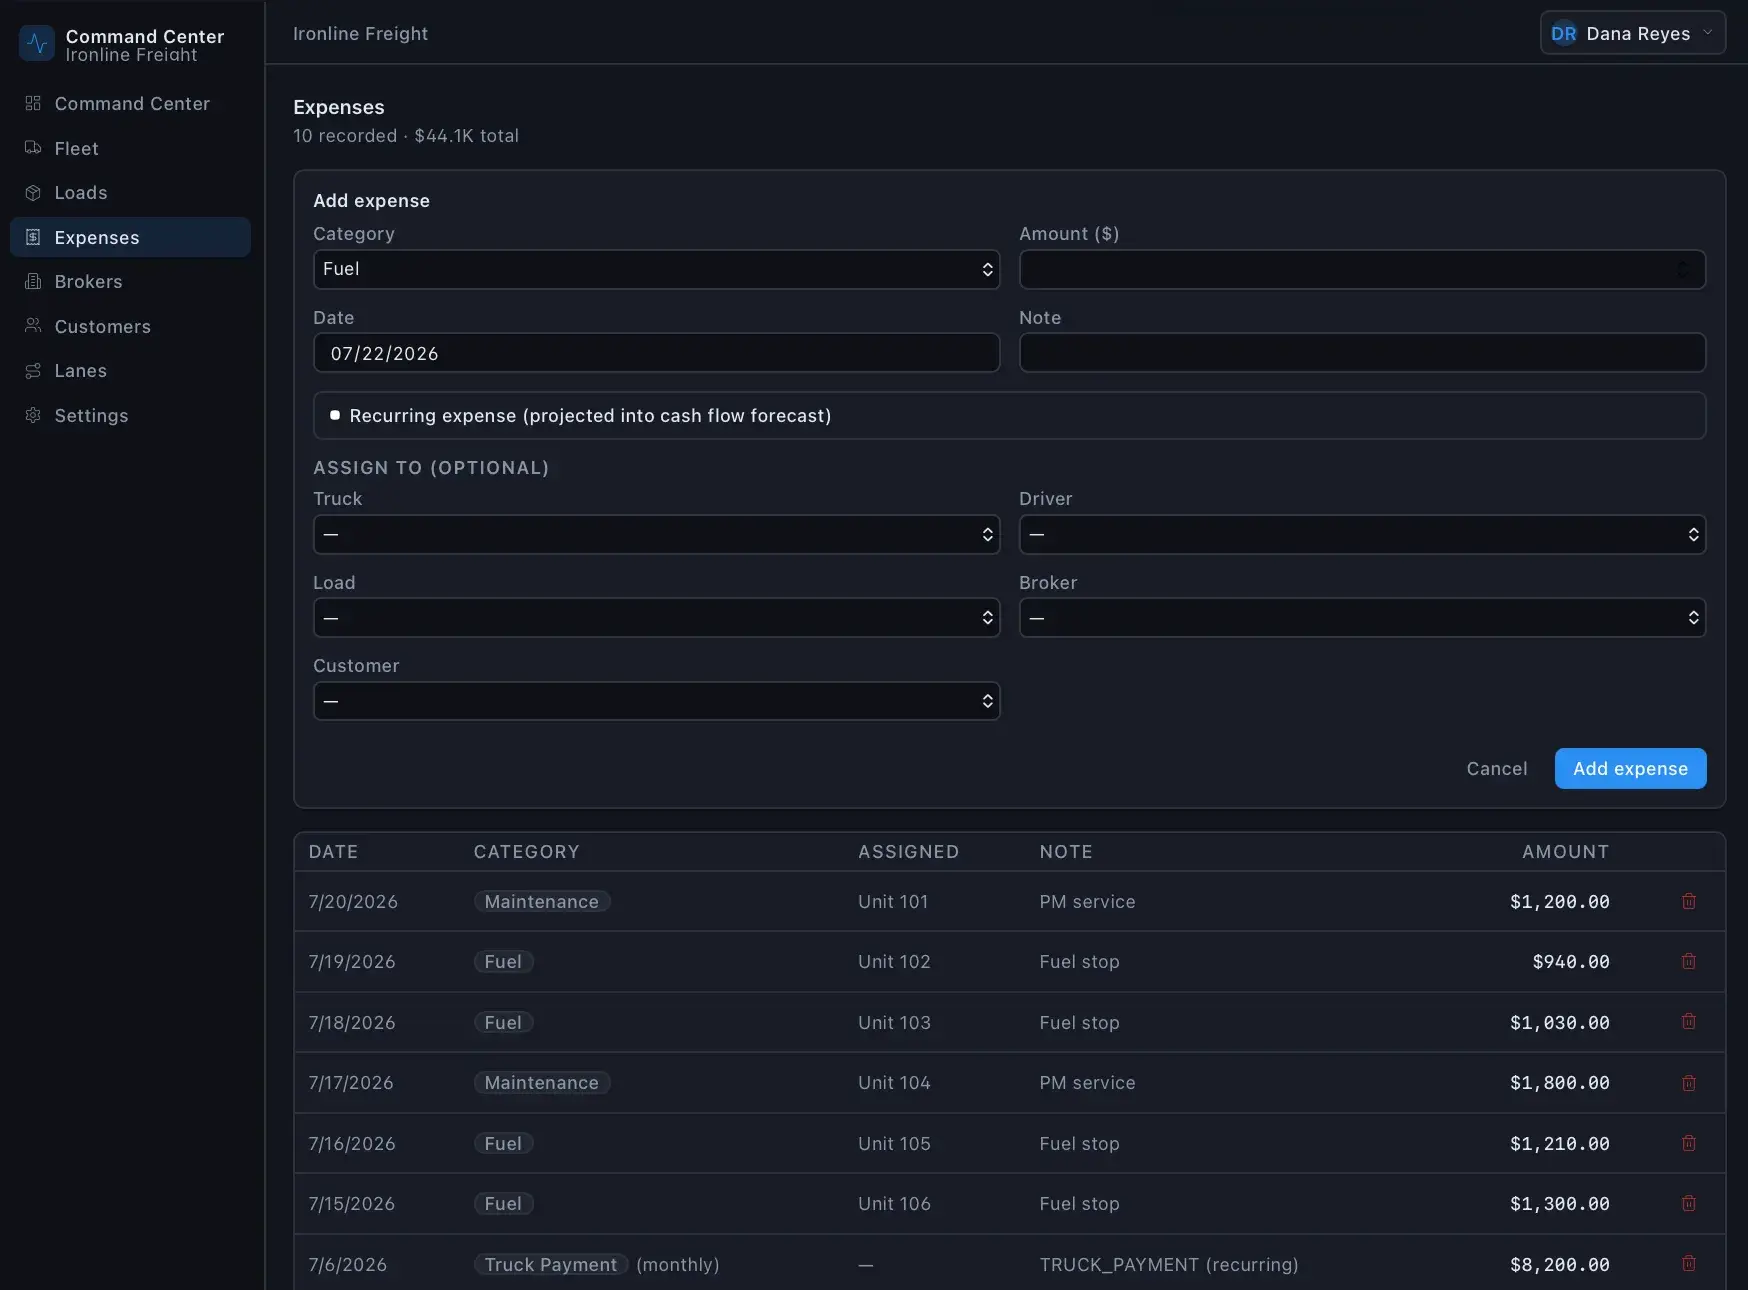
A Next.js and React application with a Prisma data layer over SQLite and authentication handled by Auth.js. Financial calculations are centralized server-side, feeding the command-center dashboard, fleet grid, and risk and reporting views.
A profitability decision tool that tells truckers whether a load is worth taking before they accept it.
Fraud defense layer for logistics teams that scores risk before freight moves or money is paid.
Predictive workforce-intelligence SaaS that flags which truck drivers are at risk of quitting, why, and what to do.
Start a project and reference this one — the conversation begins with what you have already seen.
Start a project