 Built In Oasis
Real Estate Exit Strategy Simulator
Functional DemoEnter a property once and compare flip, hold, Airbnb, seller finance, BRRRR, and wholesale exits side by side.
An interactive simulator that compares renting versus buying side by side over your timeline.
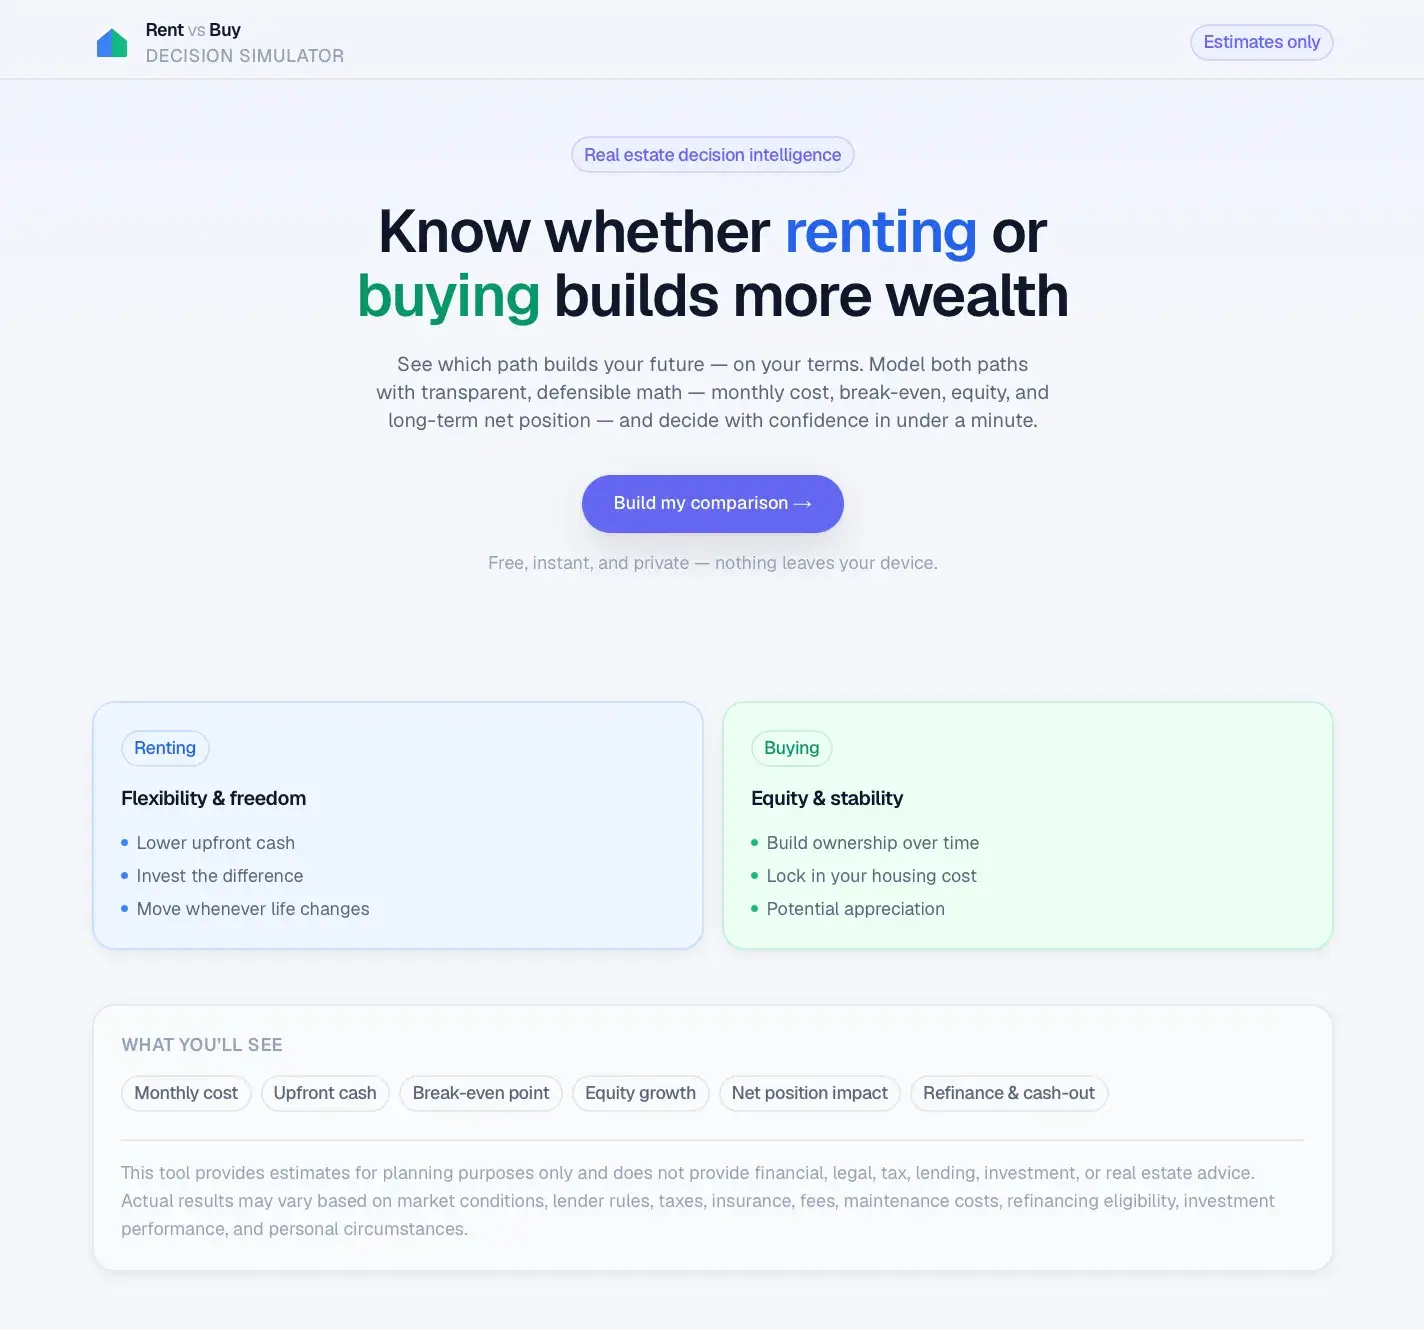
Deciding whether to rent or buy a home is confusing. The real monthly cost, upfront cash, break-even point, equity built, and long-term net worth of each path are hard to compare, and generic mortgage calculators do not show how the two financial futures diverge over time.
Built for People deciding whether to rent or buy — first-time homebuyers and renters considering buying, plus the real estate agents, mortgage brokers, and financial coaches advising them.
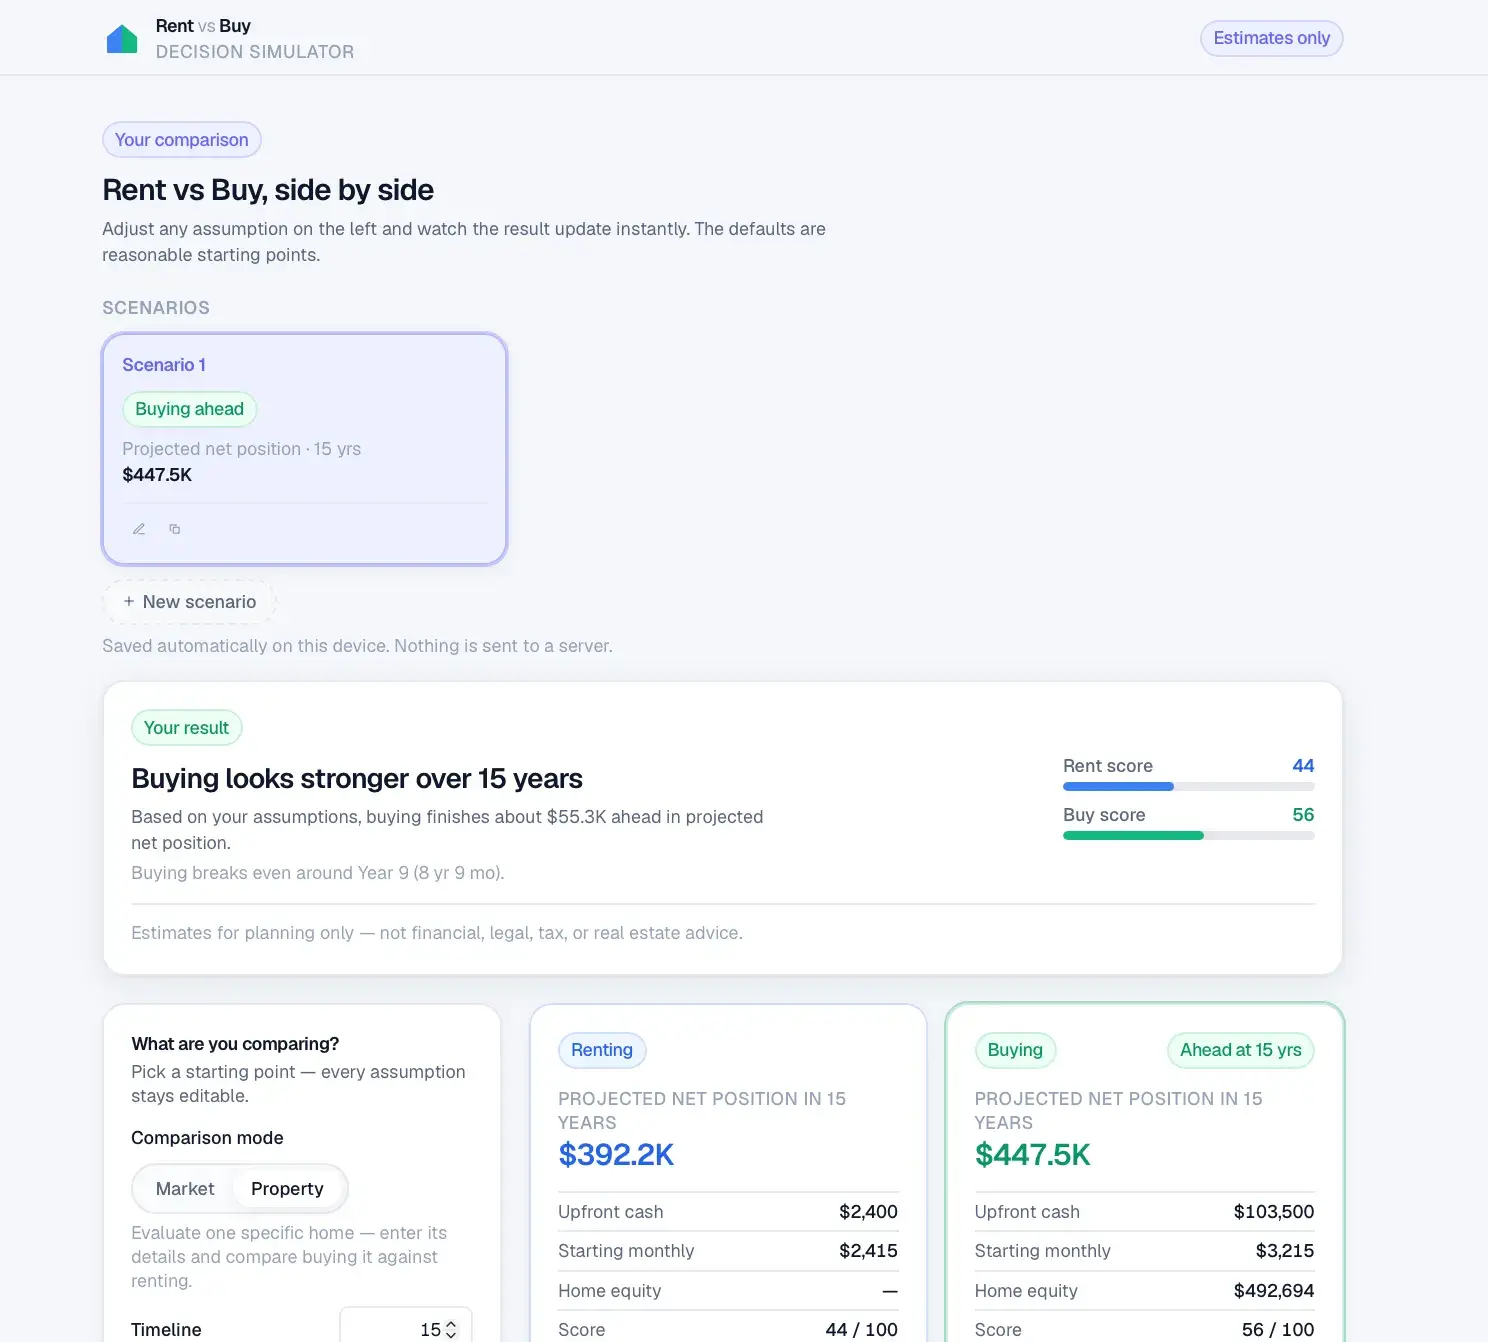
Rent vs Buy Decision Simulator compares renting and buying side by side over a chosen time horizon. Users pick Market Mode or Property Mode, enter rent or home price and a few assumptions, and instantly see monthly cost, upfront cash, break-even point, equity built, and net worth for each path, with a plain-language explanation of which path wins and when. A scenario controller adjusts rate, down payment, appreciation, rent growth, investment return, and refinance assumptions, while a game-like scoring layer of scores, meters, and milestone badges makes the tradeoffs tangible. It also simulates refinance and cash-out potential.
A deterministic, unit-tested financial engine — mortgage amortization, equity growth, appreciation, invested-savings modeling, break-even detection, and refinance/cash-out simulation — drives an interactive comparison UI that updates instantly, with gamification logic kept separate from the financial math.
Most rent-vs-buy tools are mortgage calculators. This one simulates two financial futures side by side and shows exactly when each path wins.
Market Mode
Compare renting vs buying for a city or general market.
Property Mode
Analyze a specific home with detailed assumptions.
Rent vs Buy Engine
Mortgage, equity, appreciation, and invested-savings simulation.
Decision Header
Recommended path, confidence level, and best-fit explanation.
Life Path Arena
Side-by-side Rent and Buy cards.
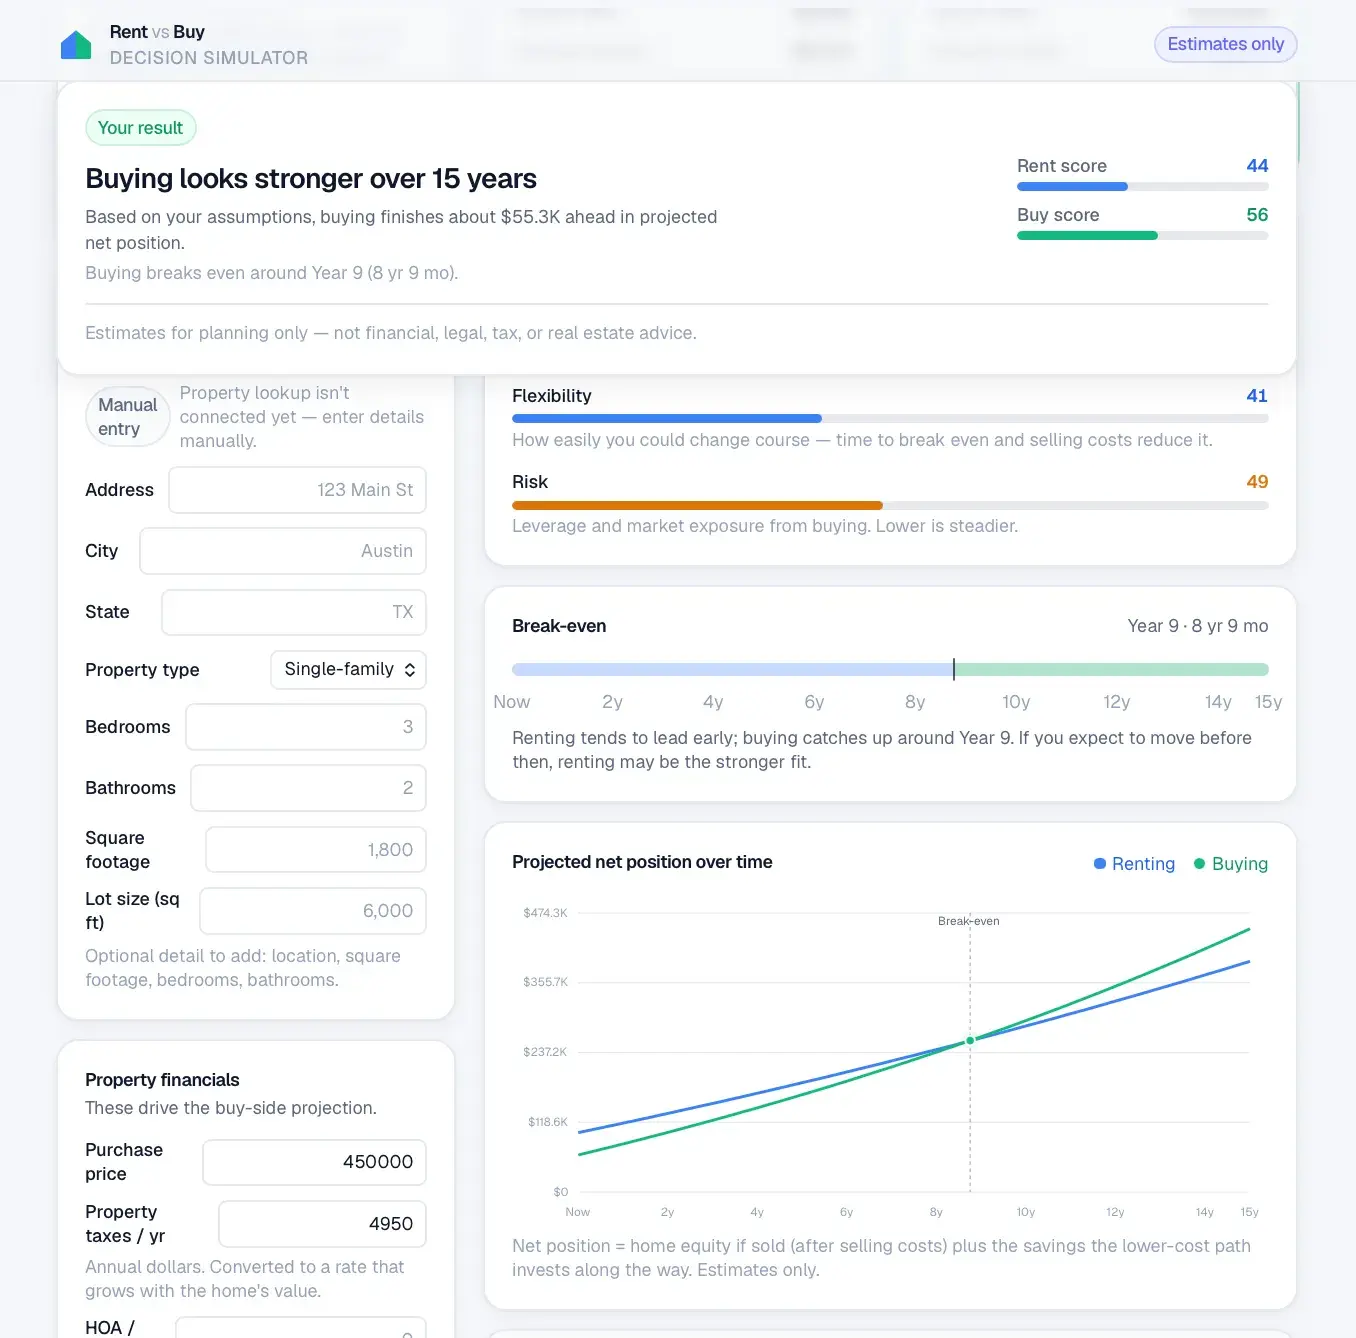
Break-Even Timeline
Visual timeline of when each path wins.
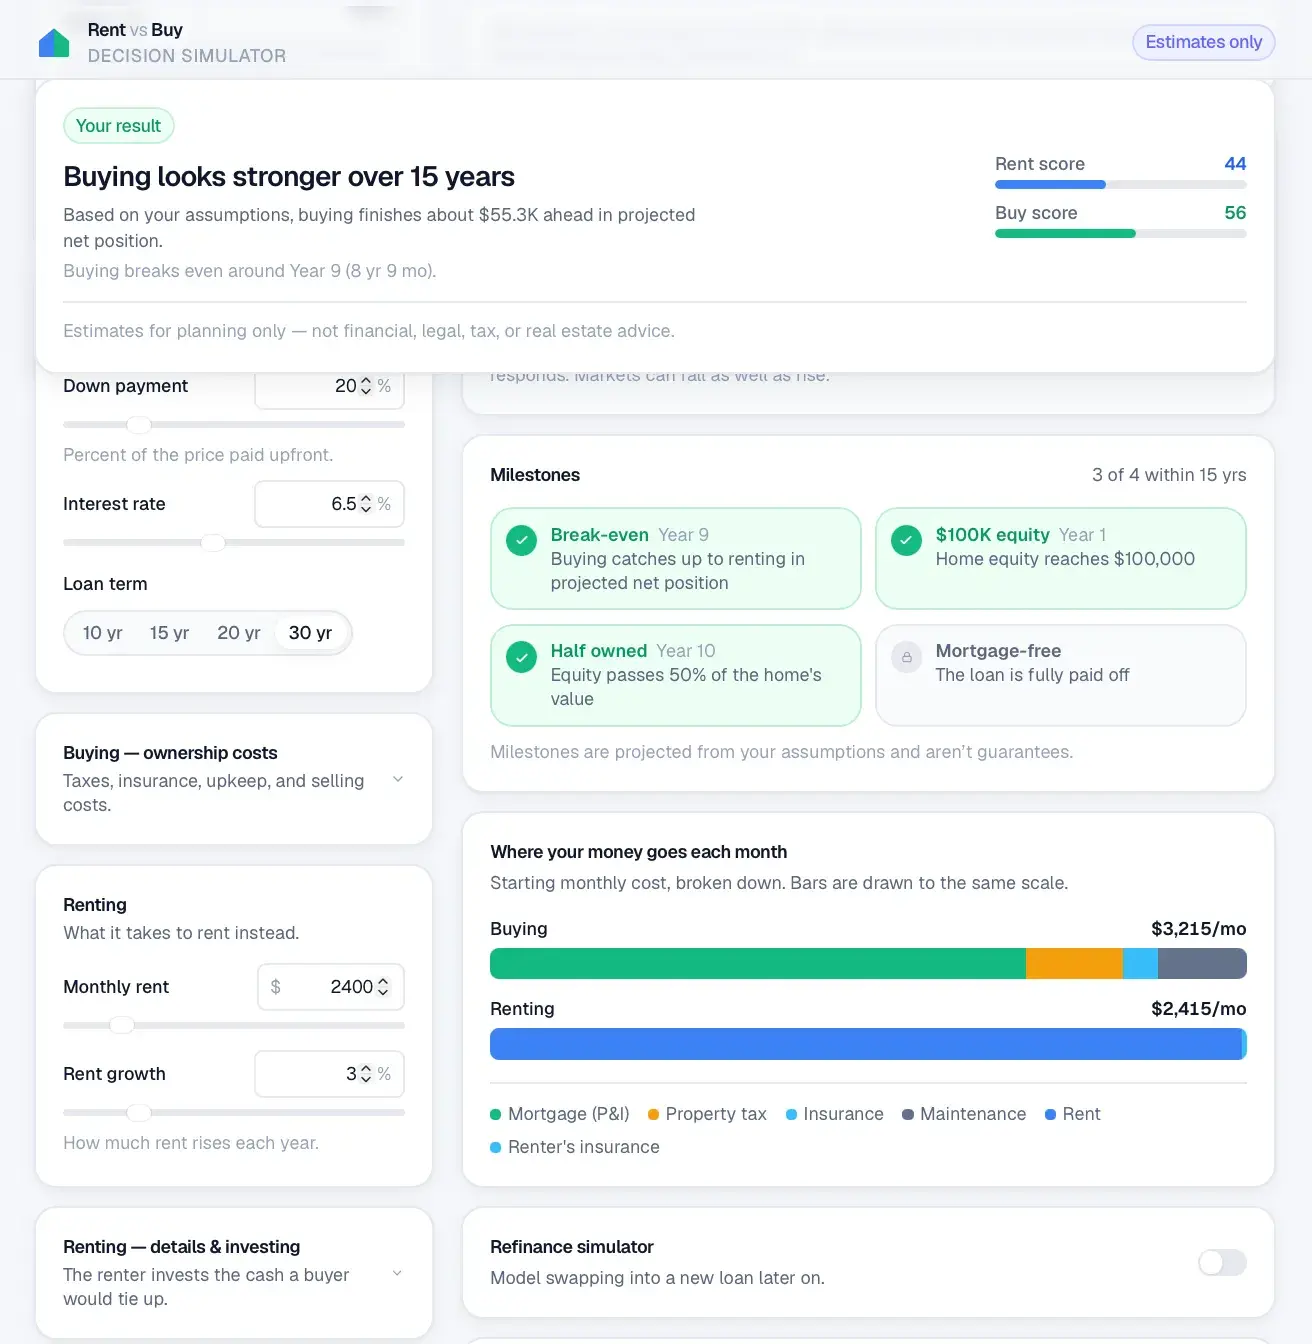
Monthly Cost Stack
True monthly cost breakdown for each path.
Wealth Timeline
Net worth over time for renter versus buyer.
Scenario Controller
Live sliders for rate, down payment, appreciation, rent growth, and more.
Refinance & Cash-Out SimulatorRefinance & Cash-Out
Models refinance savings and cash-out potential.
Life Path Score
0-100 score across affordability, wealth, flexibility, risk, and timeline.
Meters & Milestone Badges
Equity, flexibility, and risk meters with unlockable badges.
Opportunity Cards
What-if scenarios like rates dropping, rent rising, or selling in 5 years.
Pro/Con Decision Panel
Plain-language pros and cons for each path.
Scenario Builder
Save and compare multiple scenarios.
Life Path Score
How comfortably the path fits the budget.
Long-term net worth potential of the path.
Freedom to move or change plans.
Sensitivity to rate, appreciation, and rent changes.
How well the path suits the expected stay.
Upfront cash the path demands.
Future refinance and cash-out potential.
A client-side Next.js and React application. The rent-vs-buy engine is isolated TypeScript that runs in the browser and updates projections live as inputs change; optional market and property data come from configurable external APIs.
Enter a property once and compare flip, hold, Airbnb, seller finance, BRRRR, and wholesale exits side by side.
Location intelligence that scores ZIP codes by industry-specific expansion opportunity.
Automated land acquisition platform: lead sourcing, valuation, outreach, contracts, CRM, and a buyer auction marketplace.
Start a project and reference this one — the conversation begins with what you have already seen.
Start a project