 Built In Oasis


AI City Expansion Engine
Functional DemoLocation intelligence that scores ZIP codes by industry-specific expansion opportunity.
Turn scattered company data into a polished investor-ready update in minutes.
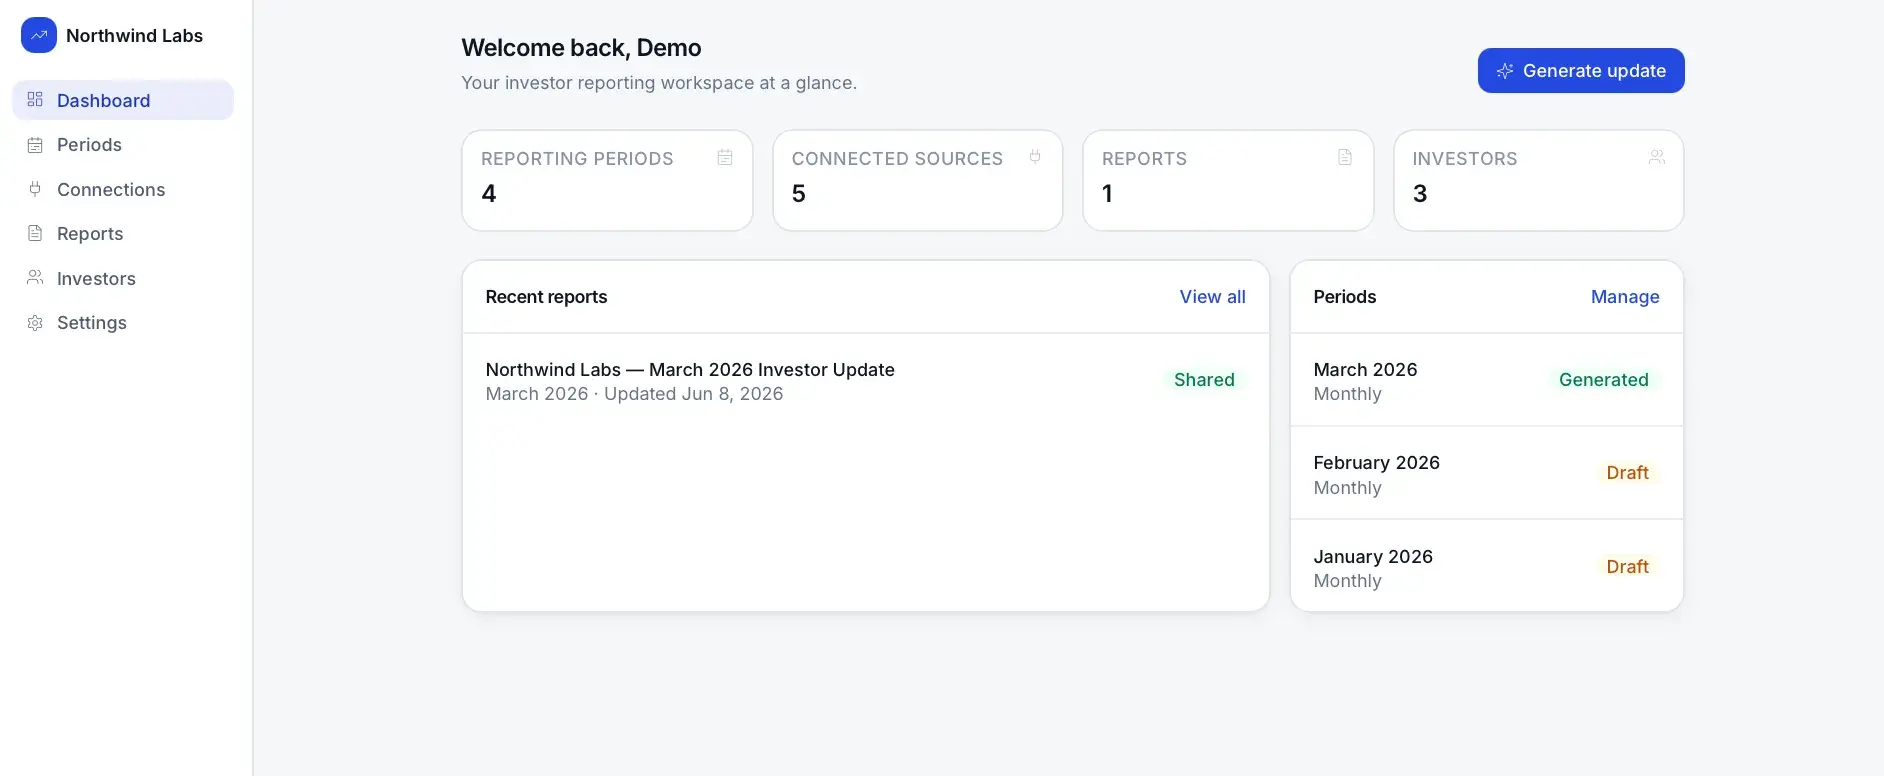
Founders and operators must update investors monthly, quarterly, or yearly, but the data lives across CRM, QuickBooks, Stripe, spreadsheets, bank reports, and memory. Updates end up inconsistent, slow to prepare, missing key metrics, and often amateur-looking, making companies appear less operationally mature than they are.
Built for Startup founders, small business owners raising capital, CFOs and fractional CFOs, investor relations teams, and accelerators managing portfolio companies.
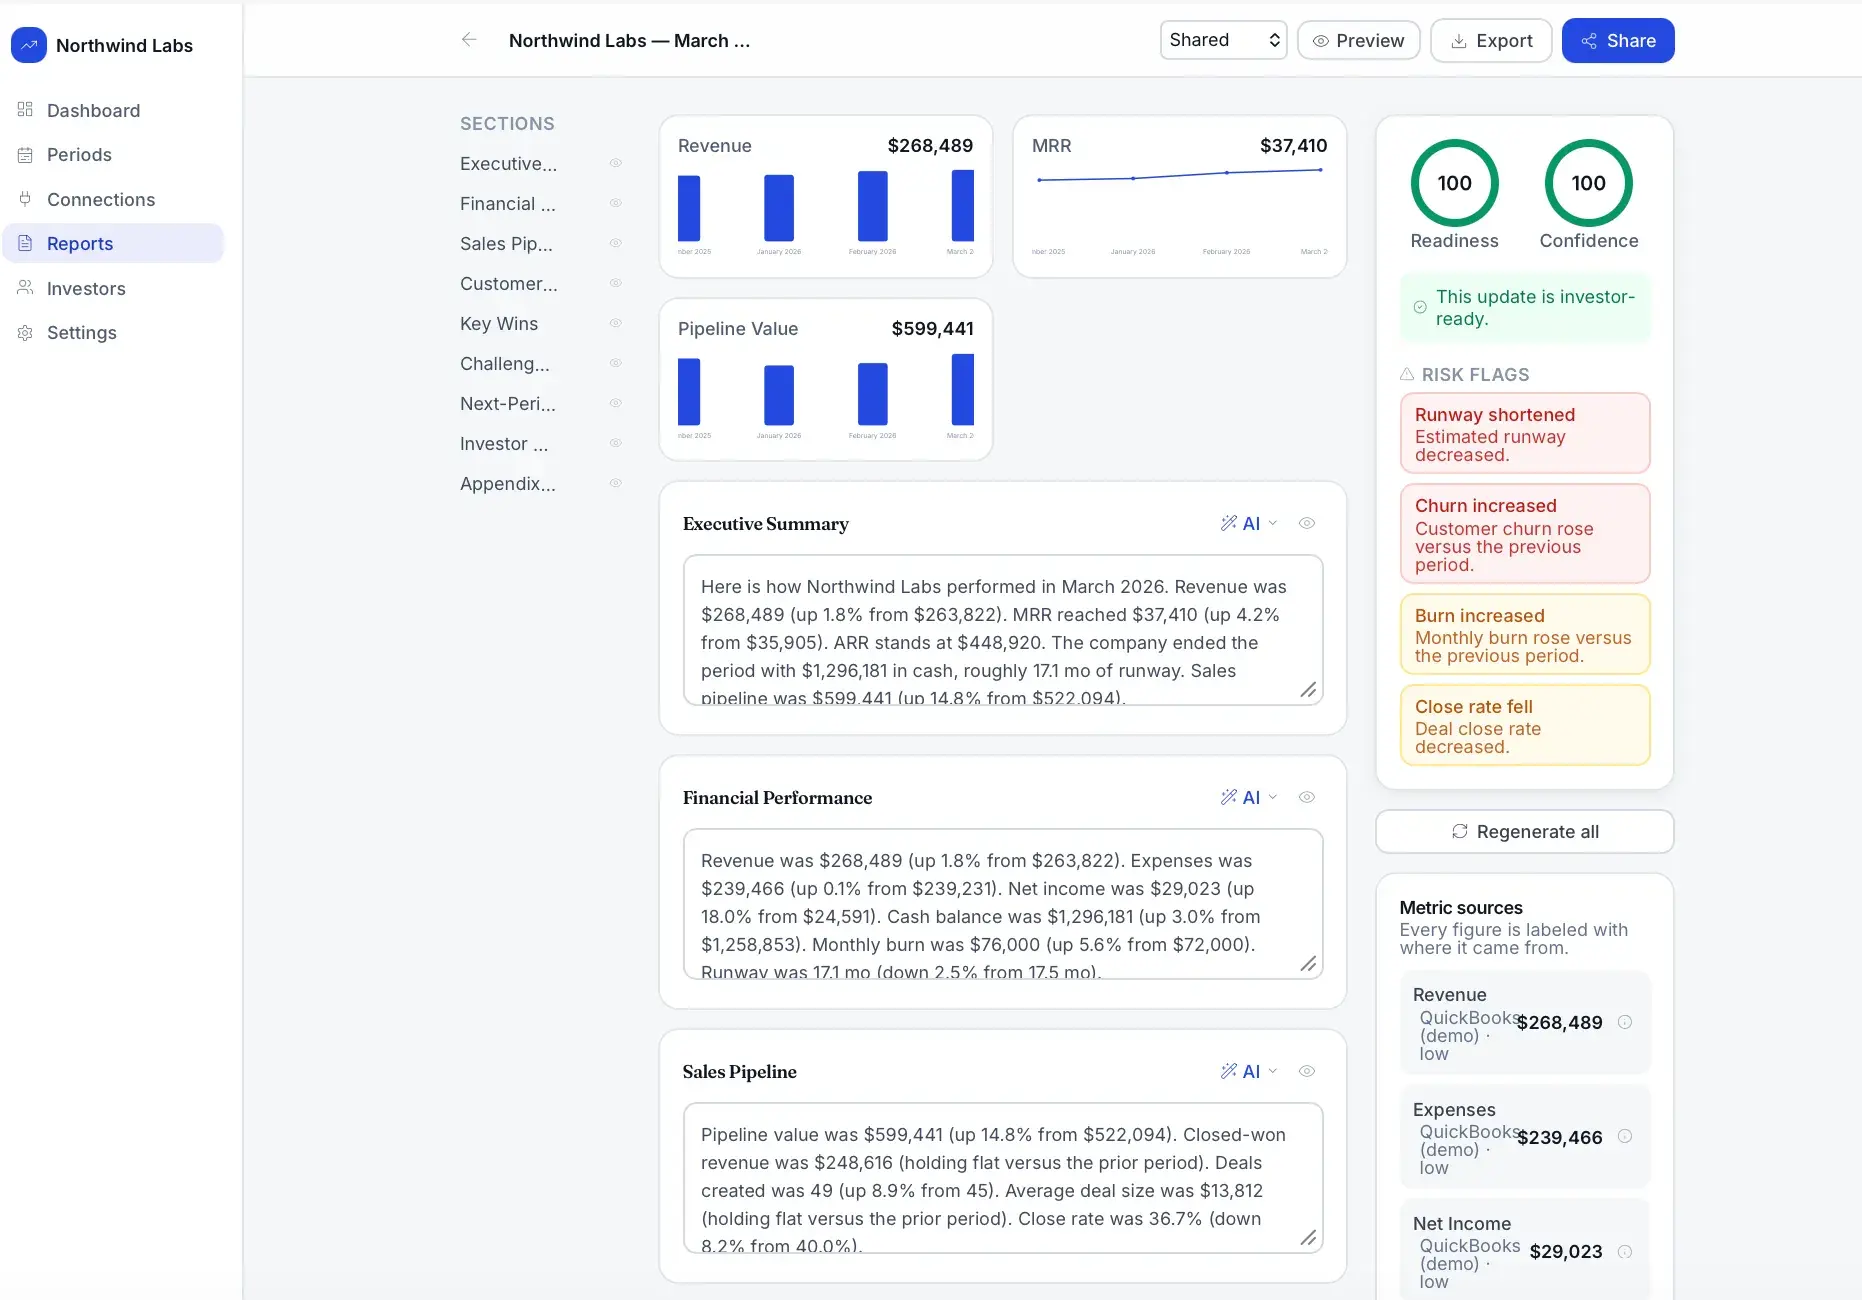
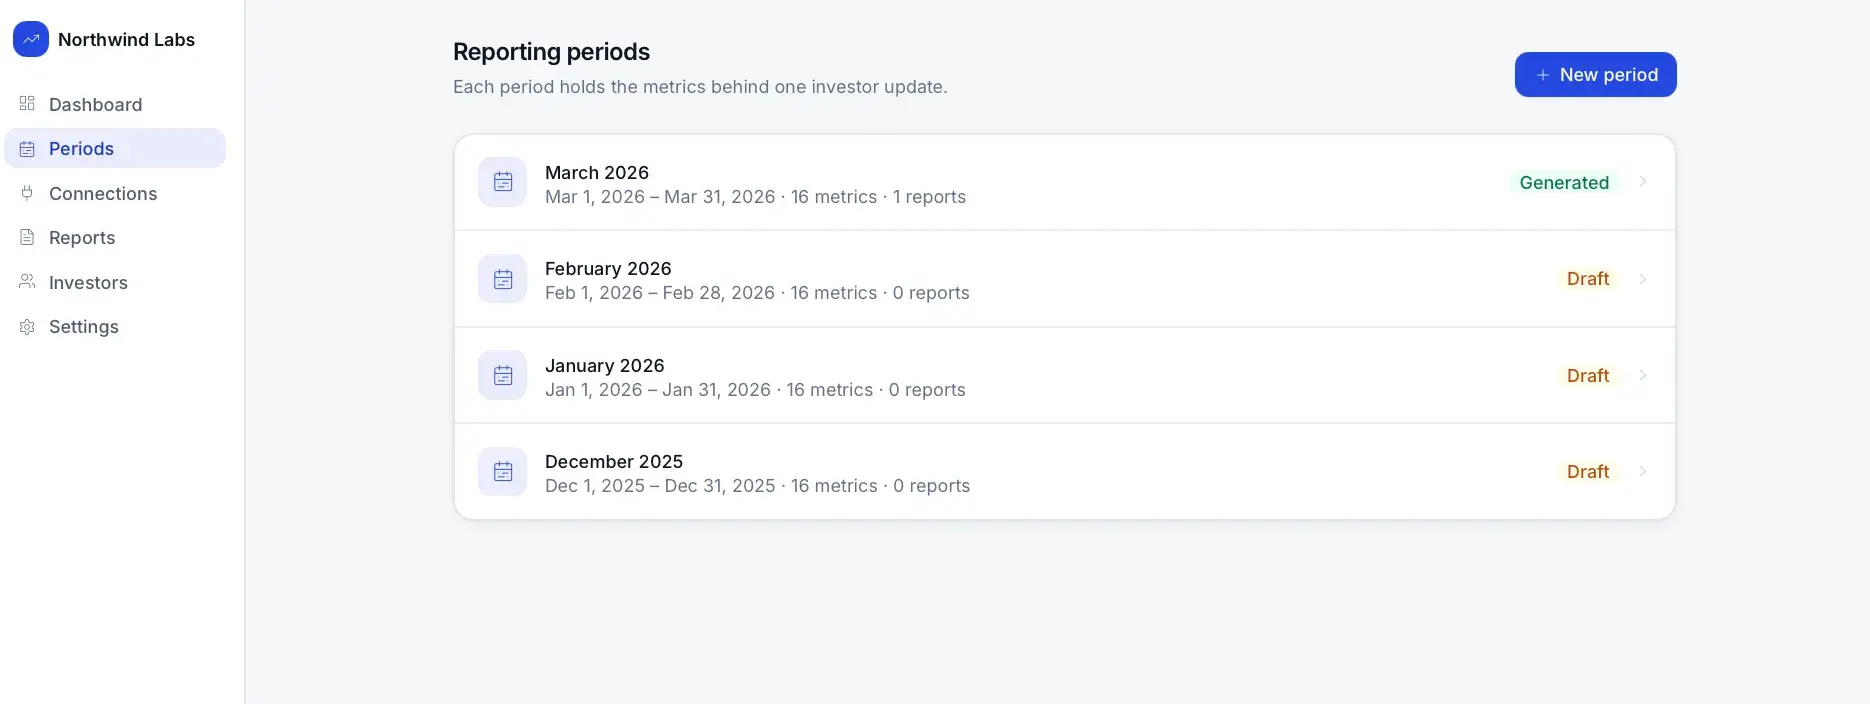
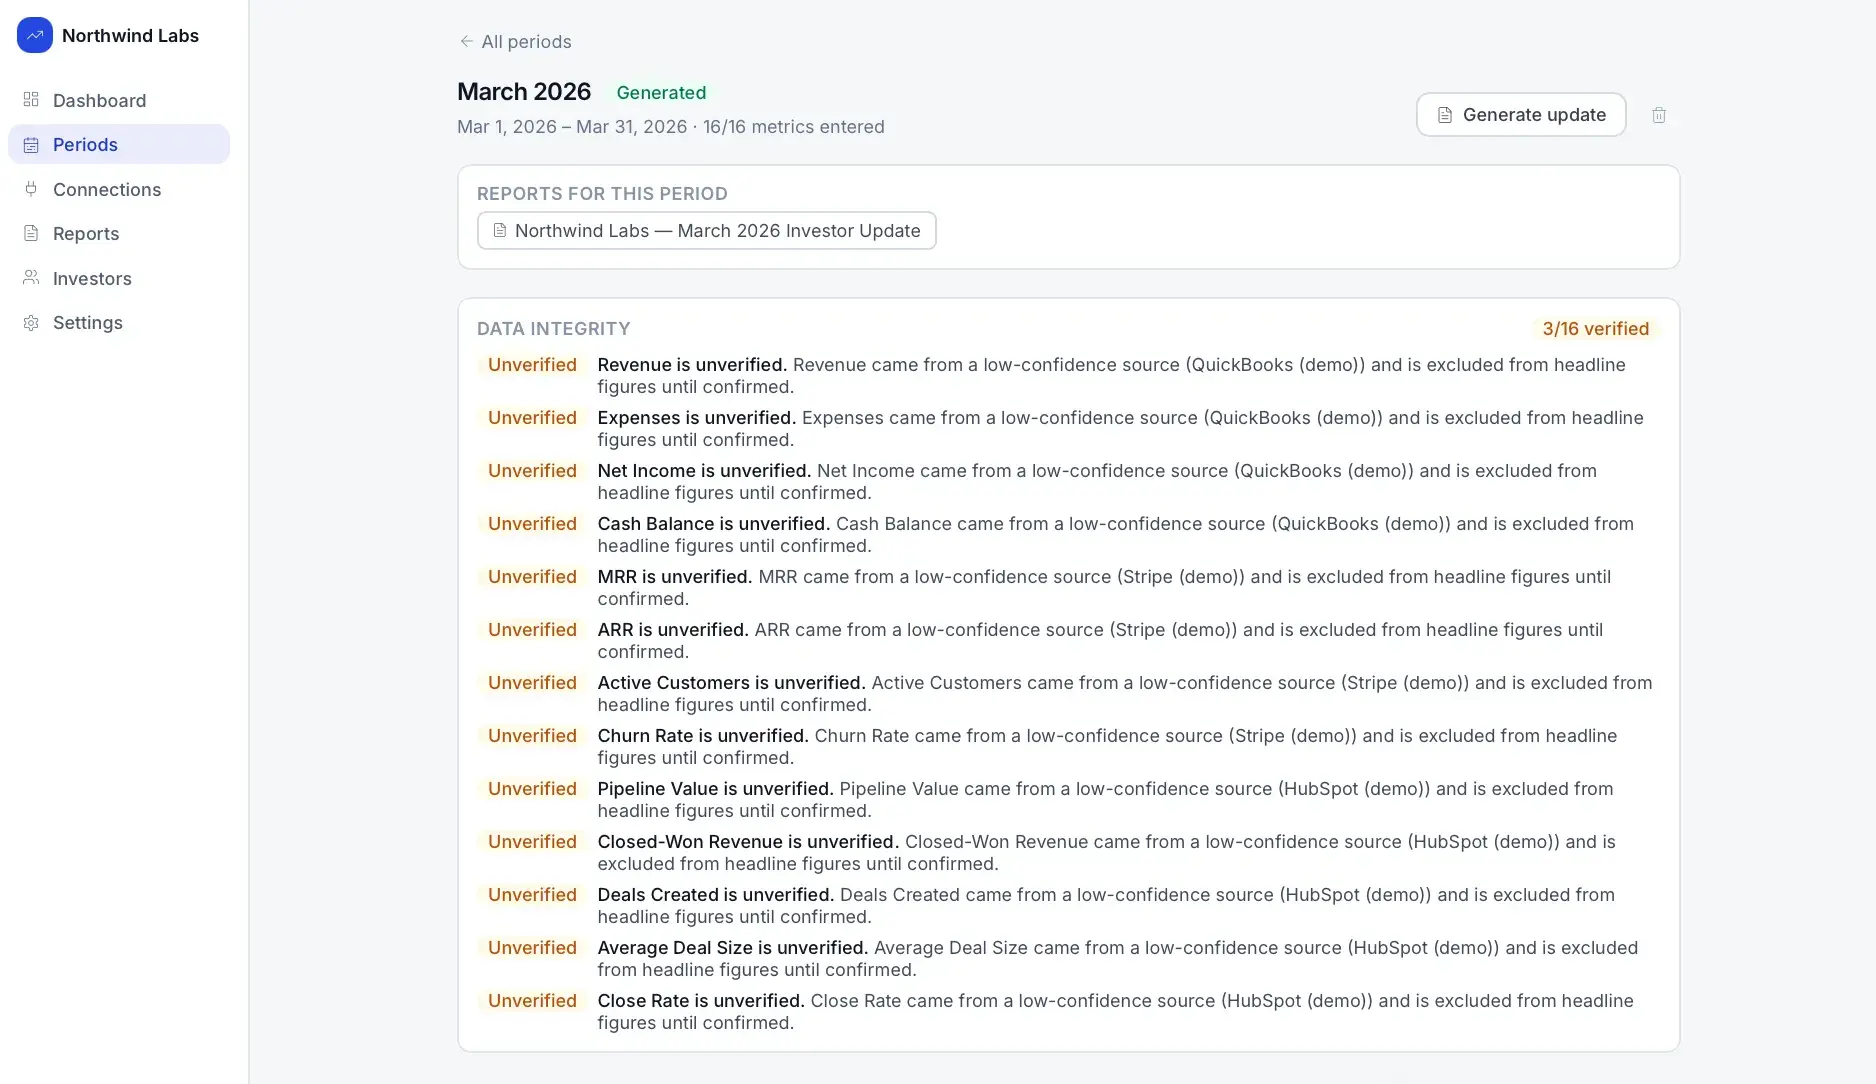
Users create a company profile, define reporting periods, and enter or connect metrics, then generate a structured investor update with executive summary, financial, sales, growth, and operating sections, key wins, risks, goals, and asks. Each metric shows current versus prior period, absolute and percentage change, trend, source, and last-synced time. A deterministic readiness score and investor-confidence score flag missing data and risks before generation, an AI narrative engine drafts and rewrites sections in a chosen tone without inventing numbers, and reports export to PDF or secure view-only share links. Manual metrics and CSV work in V1, with CRM/finance/payment connectors scaffolded.
It proves a metric-normalization and period-over-period comparison layer, deterministic readiness/confidence scoring separate from AI, an AI narrative engine constrained to verified metrics, and a secure share-link system with hashed tokens, expiration, and access tracking.
This is not a generic dashboard. It is a premium investor communication engine that turns scattered CRM, finance, and growth data into a polished investor-ready update in minutes.
Authentication & Workspace
Sign-up, company workspace, team invites, and Owner/Admin/Editor/Viewer roles.
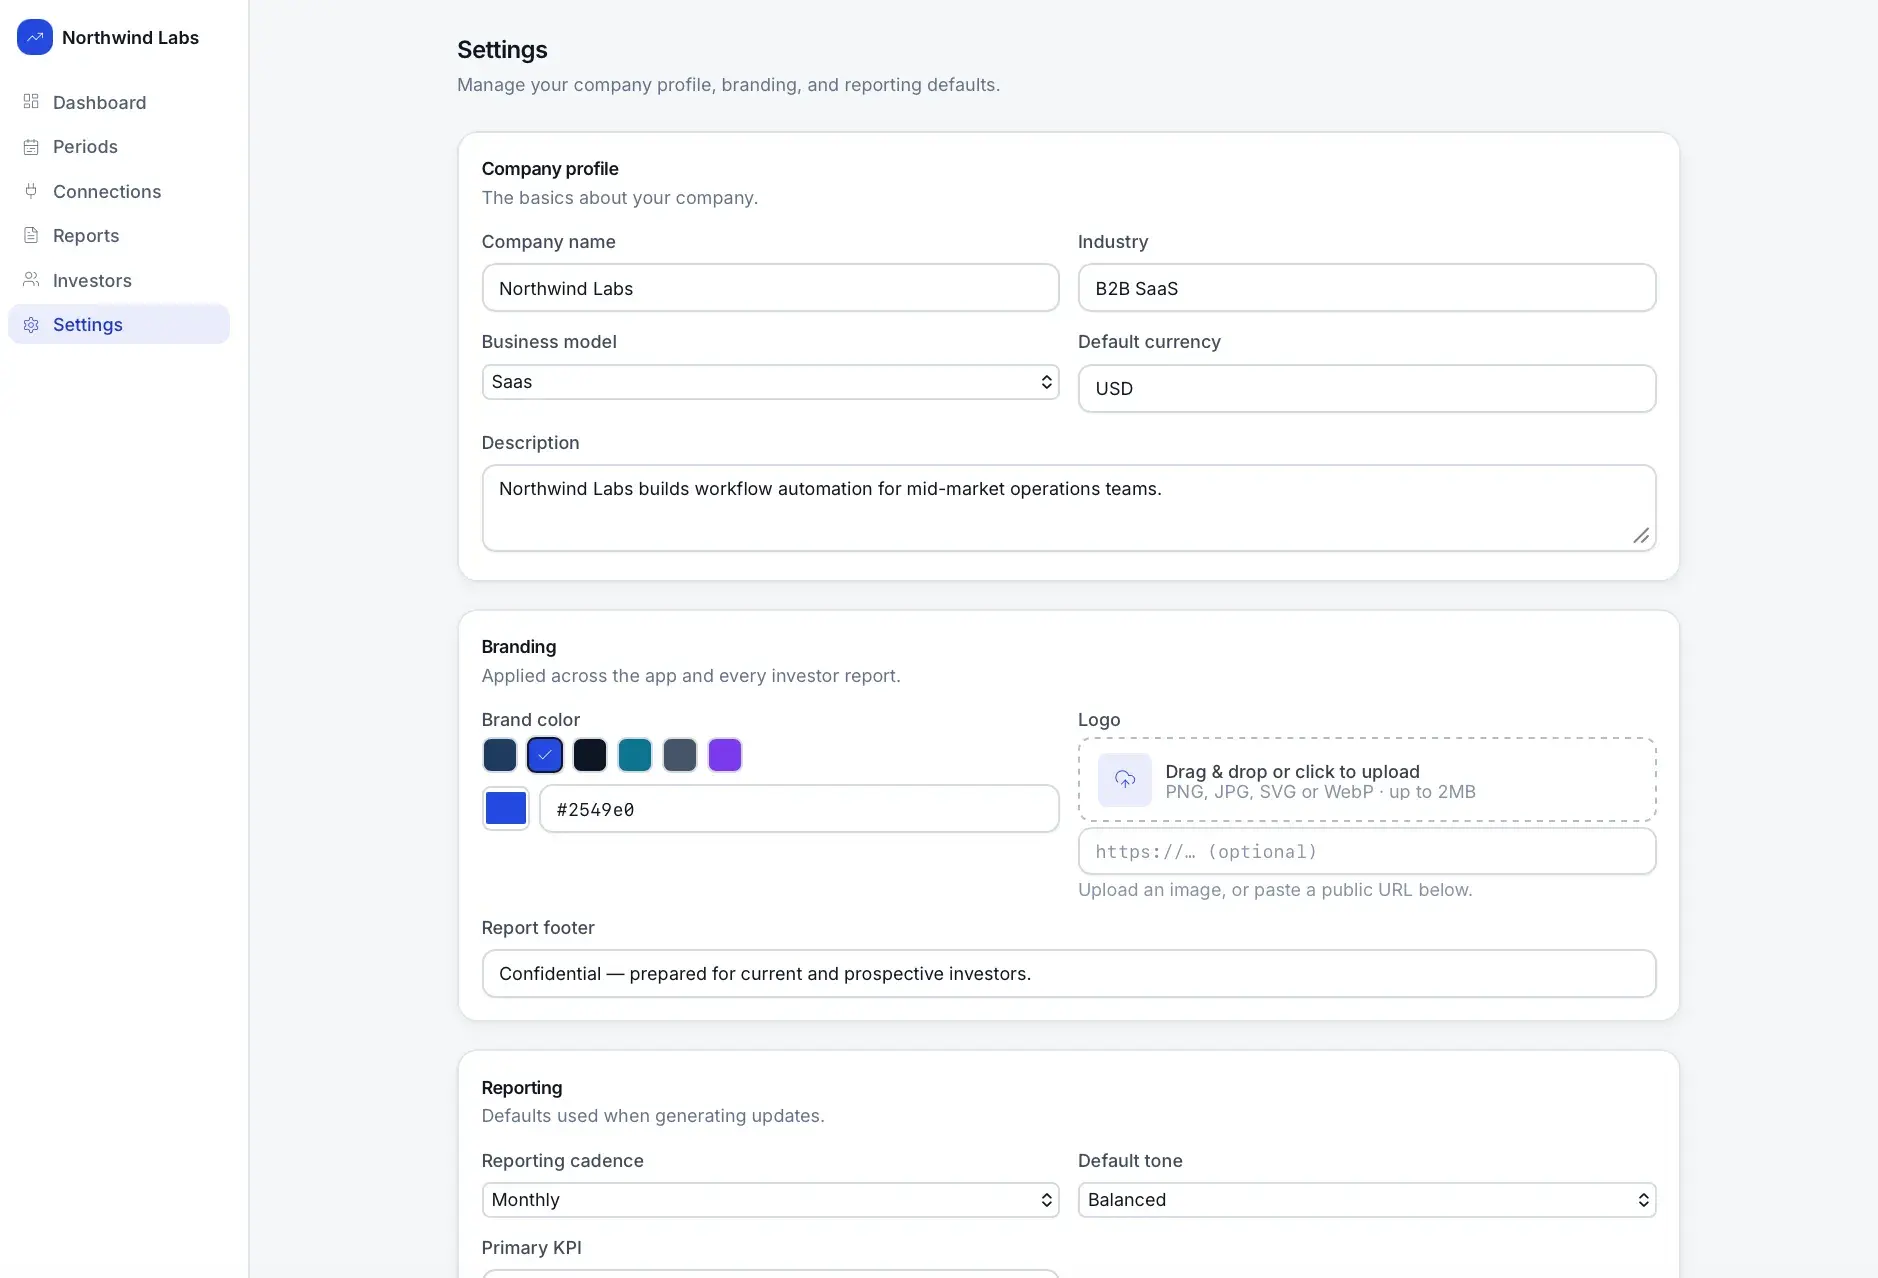
Company Profile
Industry, cadence, currency, fiscal year, and investor tone.
Data Source Connections
HubSpot, Pipedrive, Stripe, QuickBooks, manual, and CSV connectors.
Metric Mapping
Maps connected data into financial, sales, SaaS, and operational metrics.
Report Generator
Builds monthly, quarterly, yearly, or custom reports by section.
AI Narrative Engine
Writes executive summaries and commentary from verified metrics only.
Report Editor
Section navigation, editable canvas, and metric source panel.
Visual Report Design
Metric cards, revenue and expense charts, and runway indicator.
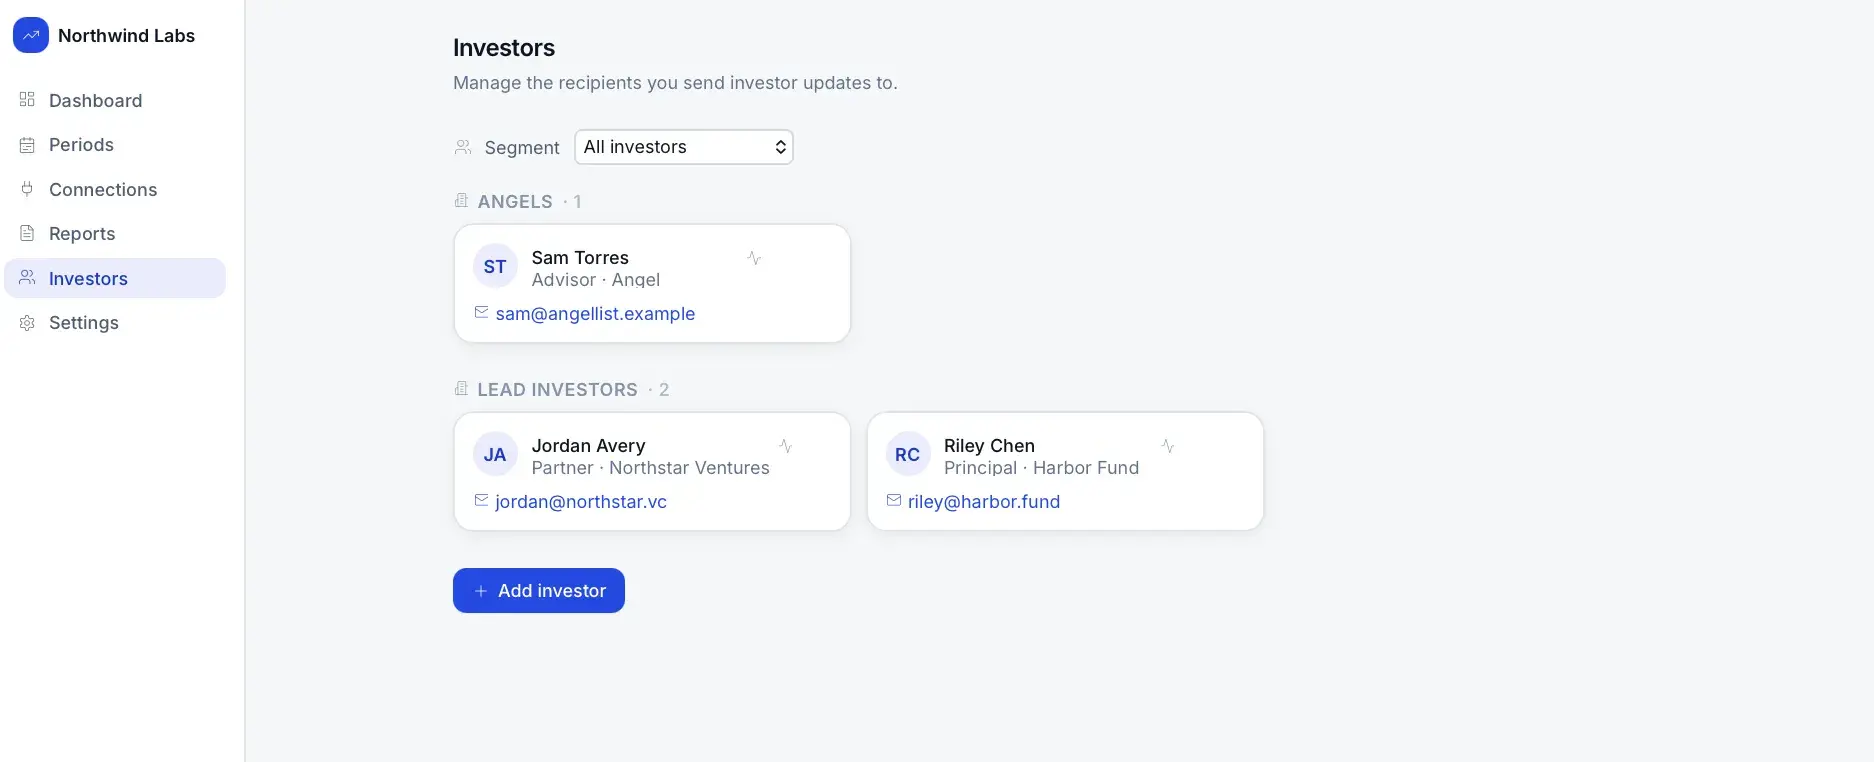
Investor Recipients
Contacts, groups, and last-sent tracking.
Export & Share
PDF, secure share link, email copy, and presentation view.
Data Completeness ScoreReport Readiness
Rates report readiness and lists missing items.
Investor Confidence ScoreInvestor Confidence
Rates communication quality for the founder before sending.
Investor Confidence Score
How clearly performance is communicated.
Coverage of required metrics.
Whether metric changes are explained.
Whether risks are surfaced honestly.
How specific next-period goals are.
Clarity and strength of investor asks.
Presentation quality of the report.
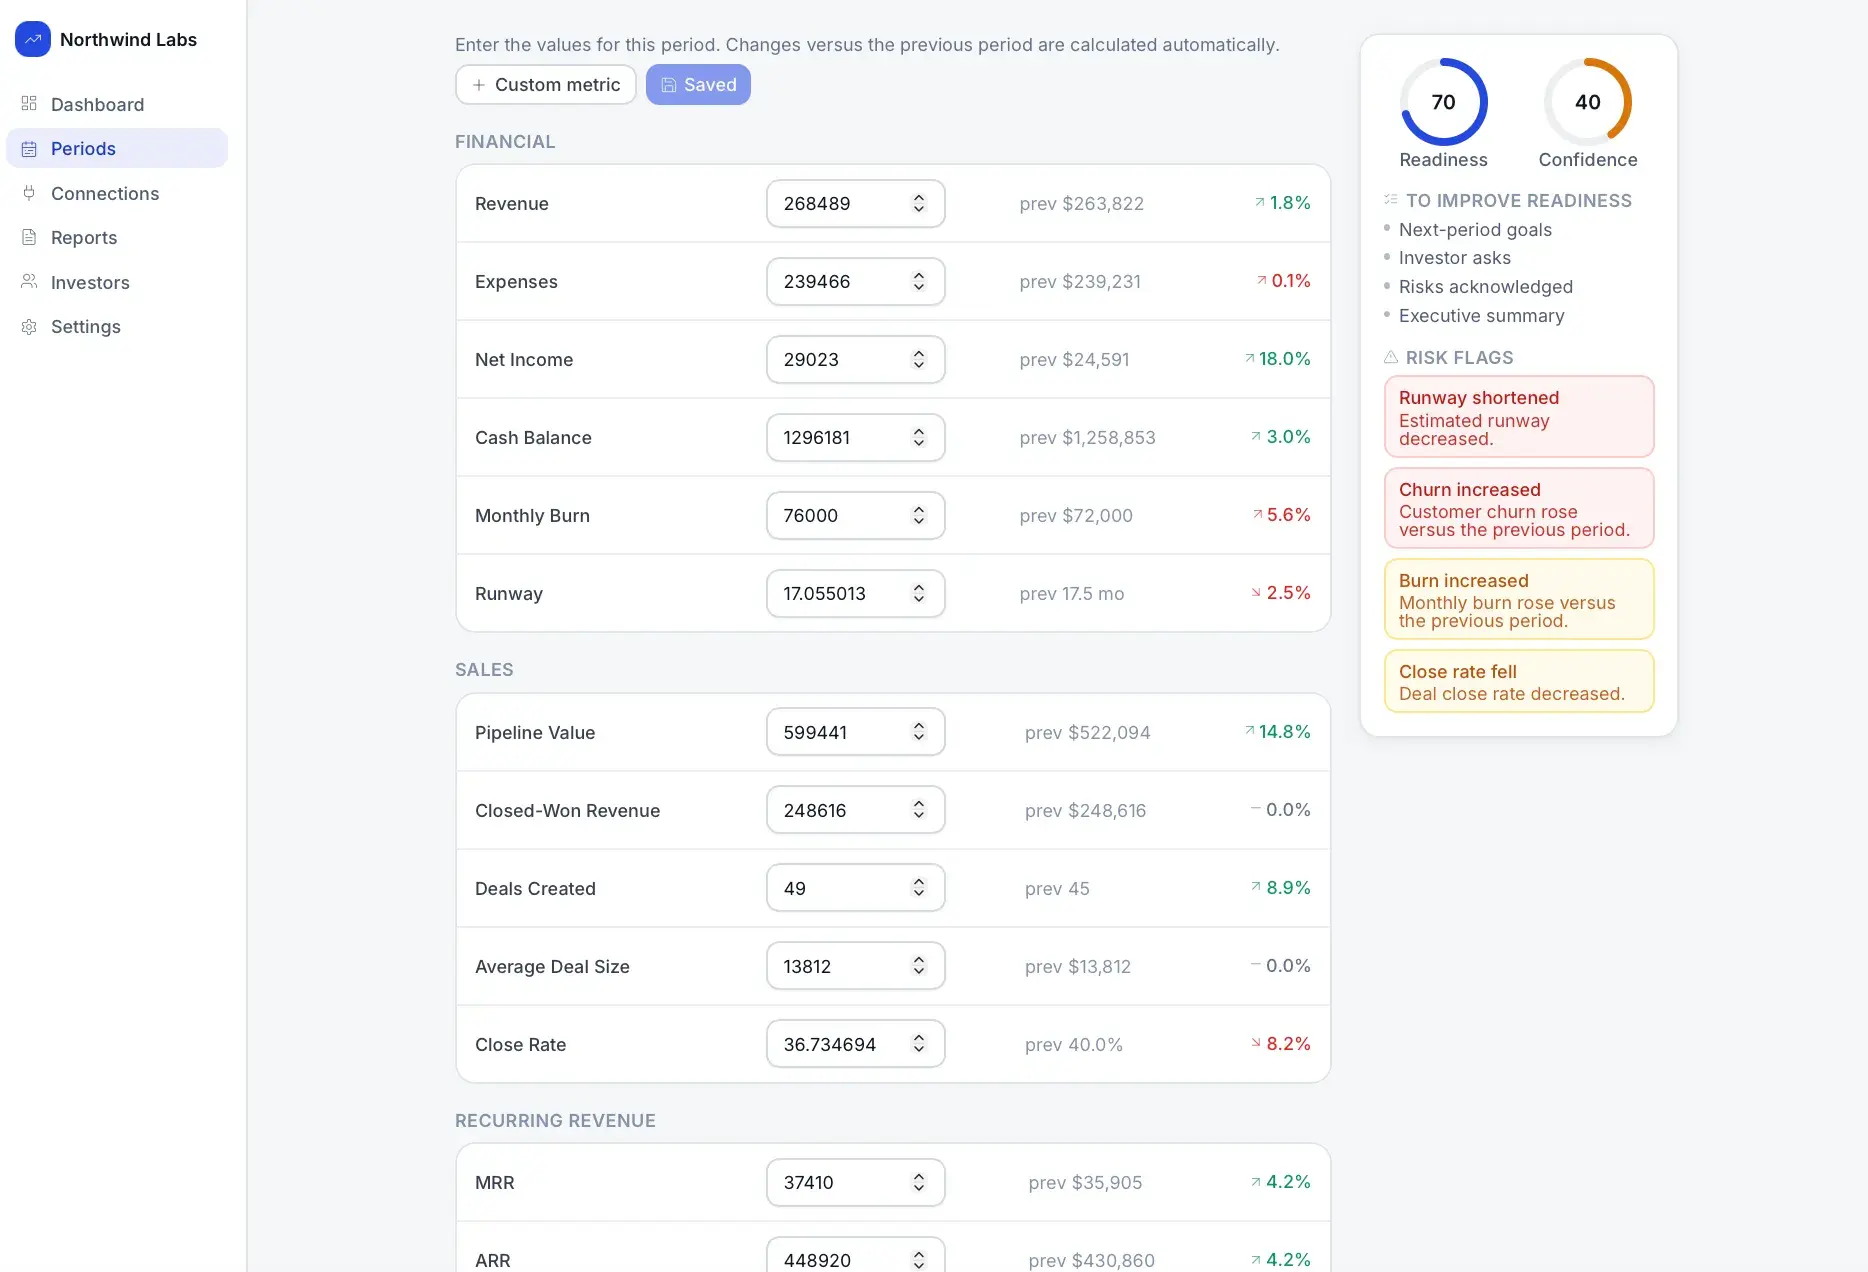
A Next.js/React app backed by Prisma over SQLite (dev) or Postgres (prod), with Auth.js authentication and encrypted token storage for data-source connections. An Anthropic integration generates narrative sections, and Resend delivers report emails with a logging fallback.
Location intelligence that scores ZIP codes by industry-specific expansion opportunity.
Model SaaS burn, runway, and hiring across scenarios, then produce board-ready reports.
Discover evidence-backed micro-SaaS opportunities from live market signals across industries and regions.
Start a project and reference this one — the conversation begins with what you have already seen.
Start a project